| | Thumbnail | | Creator | Date | Title / Author / Date / Location | Price | | | Description |
| 8163 |  | Details | Stanford, Edward | 1917 |
| 1917 Allied Propaganda Map of the Subject Nationalities of the German Alliance |
|
Stanford, Edward |
|
| 1917 |
| LOC: |
| $600.00 | Stanford--Edward | 1917-Allied-Propaganda-Map-of-the-Subject-Nationalities-of-the-German-Alliance | British First World War propaganda map using ethnic geography to challenge the legitimacy of the Central Powers. Titled "Subject Nationalities of the German Alliance," the map covers Germany, Austria-Hungary, Bulgaria, and the Ottoman Empire, extending from the North Sea to the Persian Gulf. Black identifies the principal ruling populations, while contrasting colors distinguish peoples presented as subject nationalities, including Poles, Czechs, Slovaks, South Slavs, Armenians, Kurds, Greeks, and Arabs.
<br><br>Issued circa 1917, the map quotes the Allies' response to President Woodrow Wilson's peace initiative of December 1916, invoking the rights of peoples to security and free economic development. Its stated reliance on German sources, particularly Paul Langhans's "All-Deutscher Atlas" of 1905, gives the argument a pointed rhetorical device: German cartography is used as evidence against Germany and its allies.
<br><br>Population tables reinforce the visual argument by listing nationalities, their numbers, and their proportion within each state. A separate table gives the alliance's total population from figures headed "Censuses of 1910." The map emphasizes the ethnic complexity of Austria-Hungary and the Ottoman Empire, presenting their territories as a patchwork of peoples governed by dominant minorities. Additional symbols identify German settlement expropriations and Jewish colonies in Palestine.
<br><br>An example of persuasive cartography in which color, statistics, and selective classification advance Allied war aims. The distinction between ruling and subject peoples frames national liberation as a justification for victory and anticipates the territorial debates surrounding the postwar dissolution of the Habsburg and Ottoman empires.
<br><br> |
| 8164 |  | Details | Nelson, Catherine and E. Theodore | 1943 |
| Lot of three historical pictorial maps of Brooklyn communities |
|
Nelson, Catherine and E. Theodore |
|
| 1943 |
| LOC:89 |
| $300.00 | Nelson--Catherine-and-E--Theodore | Lot-of-three-historical-pictorial-maps-of-Brooklyn-communities | One lot of three (3) historical pictorial maps of Brooklyn communities as they appeared in 1870, drawn by Catherine and E. Theodore Nelson and issued in the 1940s for George L. Clark, Inc., the real estate firm at 142 Avenue U, Brooklyn. Combining illustrated buildings, property owners' names, roads, and local landmarks, the maps reconstruct the villages before their transformation into densely developed urban neighborhoods.<br><br>The Flatbush sheet, titled <b>"The Village of Flatbush as it was in the year 1870," </B>identifies residences and their owners across an area encompassing portions of present-day Flatbush, Ditmas Park, and Prospect-Lefferts Gardens. Its subtitle describes a compilation from "old and musty records, maps and surveys," emphasizing the historical research behind the pictorial treatment.<br><br><b>"The Villages of Fort Hamilton and Bay Ridge as they were in 1870"</b> surveys the southwestern Brooklyn waterfront and adjoining countryside, including parts of present-day Dyker Heights. Roads, property holdings, and waterways establish the geography, while a soldier firing a cannon toward the Narrows supplies a playful reference to the area's military identity.<br><br><b>"The Village of Gravesend as it was in 1870"</b> records another southern Brooklyn community, prominently featuring the Prospect Park Fair Ground and Race Course, illustrated with a horse and rider. The racecourse provides a distinctive reminder of the area's nineteenth-century recreational landscape.<br><br>These maps belong to a broader body of historical village maps created by the Nelsons. Issued as real-estate promotions, they used local history and recognizable family names to connect modern neighborhoods with their rural predecessors. Together, the three sheets combine property history, pictorial cartography, and commercial advertising.<br><br> |
| 8166 |  | Details | Douglas, Jack | 1948 |
| Lot of Two Old Prospectors Maps for Arizona Lode and Placer |
|
Douglas, Jack |
|
| 1948 |
| LOC:90 |
| $1,100.00 | Douglas--Jack | Lot-of-Two-Old-Prospectors-Maps-for-Arizona-Lode-and-Placer | One lot of two complementary blueprint (cyanotype) maps of Arizona's gold-bearing districts, copyrighted 1948 by Jack Douglas of Dutch Flat, California. Rare. Not found in WorldCat.
<br><br>
The pair comprises his lode map, locating gold deposits within rock, and his placer map, identifying gold-bearing gravels and other loose deposits. White lettering and linework on blue grounds show towns, roads, county boundaries, and numbered prospecting localities linked to extensive directories below and beside each map.<br><br>
The lode map identifies 84 numbered localities, including districts around Prescott, Jerome, Oatman, Tombstone, and the Bradshaw Mountains. Entries are grouped by county, with reported county gold yields and directions from nearby settlements. The placer map similarly provides a county-by-county guide, including workings around Wickenburg, Quartzsite, the Colorado River, and the streams of Yavapai County. Together the sheets document two distinct approaches to finding gold across Arizona.
<br><br>
Published as nos. 151 and 142 in Douglas's respective lode and placer map series, which covered the western states and British Columbia. Marginal advertisements offer companion maps for $1 each or three for $2 postpaid, promote his books "Gold in Placer" and "Gold in Lode," and encourage membership in the United Prospectors organization. Practical cautions address desert travel and water supplies; notices explain that past gold discoveries do not guarantee either further finds or permission to work the ground. Small mining-tool illustrations and a vignette of an old prospector complete the designs.
<br><br> |
| 8159 |  | Details | Sutton, Ruth Haviland | 1959 |
| Decorative historical lithograph of Nantucket Island |
|
Sutton, Ruth Haviland |
|
| 1959 |
| LOC:53 |
| $395.00 | Sutton--Ruth-Haviland | Decorative-historical-lithograph-of-Nantucket-Island | Decorative historical lithograph of Nantucket Island by Ruth Haviland Sutton, published in 1959 to commemorate the 300th anniversary of the island's English settlement. Entitled "A Group of Historic Items Fron 1686 to 1957" the print celebrates Nantucket's distinctive history through an illustrated collection of objects and subjects associated with its maritime, commercial, and cultural heritage.
These incude the Old South Wharf, Great Point Light, Brant Point Light, Nantucket and Siasconset Railroad, and more.
<br><br>
Nantucket developed into one of America's foremost whaling ports during the 18th and early 19th centuries, with its ships ranging across the Atlantic and Pacific Oceans. The island's prosperity supported a substantial maritime economy, including shipbuilding, sailmaking, rope production, and the processing and export of whale oil. Following the decline of whaling, Nantucket retained much of its historic architecture and maritime character, becoming an important center for historic preservation and tourism. Sutton's lithograph reflects the growing interest in documenting and celebrating this heritage during the mid-20th century.
<br><br> |
| 8160 |  | Details | Smyrl, Jak | 1969 |
| 1969 Jak Smyrl Caricature Map of South Carolina |
|
Smyrl, Jak |
|
| 1969 |
| LOC:53 |
| $395.00 | Smyrl--Jak | 1969-Jak-Smyrl-Caricature-Map-of-South-Carolina | Colorful pictorial map of South Carolina by Jak Smyrl, copyrighted 1969 in Columbia, S.C. Titled "A Caricature Map of South Carolina," the map presents the state through a dense collection of cartoon figures, illustrated landmarks, local activities, and historical references. Town names and waterways provide a geographic framework for scenes extending from the mountainous northwest to Charleston, Beaufort, and the Atlantic coast.<br><br>The elaborate title cartouche incorporates the South Carolina flag, palmetto foliage, the Carolina wren, yellow jessamine, and an amethyst identified as the state gem. Smyrl introduces his creation with deliberately misspelled wording describing a humorous, hand-drawn assortment of places, things, and events of contemporary and historical interest, asking readers to excuse or overlook mistakes. This playful treatment continues offshore, where the "Atlantic Oshun" contains sailing vessels, sea creatures, and comic figures.<br><br>An ornamental border and prominent compass rose complete the composition. Printed in pink, yellow, green, and blue tones, the map combines regional geography with visual humor, offering an entertaining record of South Carolina's identity and popular imagery in the late 1960s.
<br><br>
Manuscript dedication to a friend with Smyrl's signature near bottom center.
<br><br> |
| 8161 |  | Details | Douglas, Jack | 1948 |
| Very Rare Blueprint Map of Nevada Gold Placers by Jack Douglas |
|
Douglas, Jack |
|
| 1948 |
| LOC:90 |
| $595.00 | Douglas--Jack | Very-Rare-Blueprint-Map-of-Nevada-Gold-Placers-by-Jack-Douglas | Very rare cyanotype (blueprint) map of Nevada's gold placer districts, published in 1948 by Jack Douglas, "The Old Prospector," of Dutch Flat, California. Designed for independent prospectors and self-published, the map identifies numbered locations where placer gold had been found, keyed to county-by-county descriptions with directions and distances from nearby settlements. Towns, rivers, county boundaries, and principal highways provide the geographic framework.<br><br>This Nevada sheet is number 139 in Douglas's advertised series of thirteen placer maps, numbered 137 through 149, covering eleven western states, Alaska, and British Columbia. Offered at $1 each or three for $2, postpaid, the series provided affordable geographic guides to reported gold occurrences. Douglas also published separate lode maps, including California map number 153, distinguishing deposits in bedrock from placer gold in loose gravel and sediment.<br><br>The Nevada directory includes Rabbit Hole, Rosebud, and Placeritas in Pershing County; Manhattan and Round Mountain in Nye County; and Eldorado near Nelson in Clark County. An entry near Las Vegas records placer ground submerged beneath Lake Mead. Additional notes acknowledge gold in bedrock crevices and caution that a reported occurrence does not guarantee permission to prospect.<br><br>Practical instructions advise motorists to inquire locally before leaving numbered highways, carry extra water, and place brush beneath tires when bogged down. Crossed mining tools, a compass indicator, and a small prospector illustration decorate the sheet. Advertisements promote Douglas's book "Gold in Placer" and membership in the United Prospectors organization, placing the map within his broader program of publications and support for small-scale gold seekers.
<br><br> |
| 8165 |  | Details | Douglas, Jack | 1948 |
| Jack Douglas's Blueprint Map of New Mexico Gold Lode Districts |
|
Douglas, Jack |
|
| 1948 |
| LOC:90 |
| $595.00 | Douglas--Jack | Jack-Douglas-s-Blueprint-Map-of-New-Mexico-Gold-Lode-Districts | Blueprint prospecting map of New Mexico by Jack Douglas, published from Box 21, Dutch Flat, California. White lettering and linework on a blue ground identify roads, county boundaries, towns, and numbered gold-bearing localities keyed to descriptions arranged by county. The map concerns gold occurring in lodes, or mineral deposits within rock, complementing Douglas's separate series of placer maps.<br><br>
The numbered entries direct prospectors to localities in Socorro, Sierra, Grant, Hidalgo, Dona Ana, Taos, and other counties. Practical cautions advise carrying a reliable road map and extra water, investigating desert ground before leaving the road, and avoiding abandoned shafts. Small illustrations of mining tools and an old prospector accompany the title.<br><br>
Issued as part of Douglas's regional gold-lode map series covering the western states and British Columbia. An advertisement offers companion maps at $1 each or three for $2 postpaid, alongside prospecting books and equipment plans. An invitation to join the United Prospectors places the publication within a wider network supplying information and assistance to amateur miners.<br><br> |
| 8157 |  | Details | Sargent, Bernard | 1955 |
| Pictorial Map of South Africa by Bernard Sargent |
|
Sargent, Bernard |
|
| 1955 |
| LOC:54 |
| $400.00 | Sargent--Bernard | Pictorial-Map-of-South-Africa-by-Bernard-Sargent | Colorful pictorial map of South Africa, designed and drawn in Pretoria by Bernard Sargent. The map presents the country's cities, wildlife, scenery, and visitor attractions through numerous illustrated vignettes, with roads and railways connecting Cape Town, Port Elizabeth, East London, Durban, Johannesburg, and Pretoria. The provinces of Cape of Good Hope, Orange Free State, Transvaal, and Natal are identified, together with Basutoland and neighboring territories.
<br><br>
An elaborate scroll cartouche introduces South Africa as a land "beloved of the Sun." Illustrations depict game animals, waterfalls, historic buildings, coastal resorts, and outdoor recreation, with Kruger National Park prominently featured in the northeast. Fish, sharks, a seahorse, and a sailing vessel fill the surrounding oceans. A large compass rose and a historical vignette commemorating Bartholomew Dias's voyage around the Cape complete the maritime decoration.
<br><br>
The broad ornamental border combines indigenous plants and animals, allegorical figures, provincial emblems, and descriptions of regional attractions. The national arms appear above the map beneath draped curtains. Its combination of tourist promotion, natural history, and historical imagery presents an idealized view of South Africa; the border's language and some figure illustrations also reflect the racial stereotypes of its period. |
| 8143 |  | Details | U.S. Coast and Geodetic Survey | 1853 |
| Chart of the Entrance to Timballier Island Louisiana |
|
U.S. Coast and Geodetic Survey |
|
| 1853 |
| LOC:90 |
| $125.00 | U-S--Coast-and-Geodetic-Survey | Chart-of-the-Entrance-to-Timballier-Island-Louisiana | 1853 engraved nautical chart of Grand Pass at the entrance to Timbalier Bay, Louisiana, prepared by F. H. Gerdes under U.S. Coast Survey superintendent A. D. Bache. The chart, likely from a contemporaneous Cosat Survey chart book, depicts Timbalier Island and East Timbalier Island, with their irregular shorelines, marshes, and tidal inlets bordering the Gulf of Mexico.
<br><br>Numerous depth soundings define the approach across the offshore bar and through Grand Pass. Shoals, the designated sailing line, a prominent compass rose, and accompanying sailing directions emphasize the chart's practical navigational purpose. Scales provide distances in statute and nautical miles. Titled <i>Preliminary Reconnaissance of Grand Pass, Entrance to Timbalier Bay, Louisiana.</i>
<br><br> Sailing directions include: "“Run for the Point of the West beach N.W. by W. over the Bar on this course and keep on it 'till within 300 yards of the beach, then pass the Point and haul up N.N.W.1/2W. Anchor in 14 feet.” |
| 8144 |  | Details | Holladay, John | |
| Atlanta Under Construction Humorous City View by John Holladay |
|
Holladay, John |
|
|
| LOC:150 |
| $250.00 | Holladay--John | Atlanta-Under-Construction-Humorous-City-View-by-John-Holladay | Colorful cartoon view of Atlanta by John Holladay, depicting the city engulfed in construction and traffic. Tower cranes rise among downtown skyscrapers while unfinished highways, detours, and crowded ramps fill the foreground. The gold-domed Georgia State Capitol stands amid the surrounding towers, with the Equitable building prominently identified in the skyline. Dated within to 1987.
<br><br>MARTA trains and buses compete for space with trucks and tightly packed automobiles. Construction workers, frustrated motorists, contradictory road signs, and a conspicuous "Road Closed Take Detour" notice reinforce the satire of a growing city struggling to keep moving. A large ribbon bearing the name "Atlanta" anchors the composition beside an "Under Construction" barricade.
<br><br>Signed in the image by John Holladay and published by Holladay Prints, Inc., Davenport, Iowa. An entertaining urban caricature emphasizing Atlanta's development, transportation infrastructure, and traffic congestion. |
| 8146 |  | Details | West House of Maps | 1985 |
| 1984 Pictorial Map of Siesta Key, Florida |
|
West House of Maps |
|
| 1985 |
| LOC:87 |
| $225.00 | West-House-of-Maps | 1984-Pictorial-Map-of-Siesta-Key--Florida | Colorful 1984 bird's-eye advertising map of Siesta Key, Florida, published by West House of Maps, Sarasota, with artwork attributed to Harry A. West. The island is depicted between the Gulf of Mexico, Roberts Bay, and Little Sarasota Bay, with its long beaches, residential canals, bridges, and principal roads, including Ocean Boulevard, Beach Road, and Midnight Pass Road.<br><br>Illustrated buildings and promotional signs identify hotels, condominiums, restaurants, shops, marinas, and real estate offices. Border advertisements and a prominent Cascade Inc., Realtors panel emphasize the map's commercial purpose. Beachgoers, sailboats, fishing boats, and marine life animate the surrounding waters, while a cartoon Neptune holds a trident near the title.<br><br>The reverse includes an indexed street map and the publisher's imprint, identifying this as the 1984 edition of a work copyrighted in 1975. Combining practical navigation with pictorial advertising, the map records Siesta Key's tourism and waterfront real estate businesses during the period.
<br><br> |
| 8148 |  | Details | U.S. Coast and Geodetic Survey | 1854 |
| 1854 U.S. Coast Survey Progress Map of the Florida Reefs and Keys |
|
U.S. Coast and Geodetic Survey |
|
| 1854 |
| LOC:87 |
| $125.00 | U-S--Coast-and-Geodetic-Survey | 1854-U-S--Coast-Survey-Progress-Map-of-the-Florida-Reefs-and-Keys | 1854 U.S. Coast Survey map showing the progress of surveying along the Florida Reefs between 1849 and 1854, prepared under superintendent A. D. Bache. Titled <i>Sketch F. No. 2, Showing the Progress of the Survey of the Florida Reefs</i>, the sheet combines coverage of Key Biscayne, Biscayne Bay, and the upper Florida Keys with separate inset maps of <b>Key West, the Dry Tortugas, Bahia Honda, and Coffins Patches.</b>
<br><br>A dense network of triangulation lines connects named survey stations across the islands, reefs, and coastal waters. These geometric frameworks record the work used to establish positions for subsequent detailed coastal mapping. Numerous keys, channels, banks, and shoreline features are identified, with Florida Bay and Barnes Sound providing geographic context.
<br><br>The sheet documents the Coast Survey's developing coverage of southern Florida, emphasizing survey progress and control networks rather than the depth soundings of a finished navigational chart. The Key West and Dry Tortugas insets extend its coverage to the western end of the island chain. |
| 8149 |  | Details | Lloyd, Nancy | 1985 |
| 1985 Pictorial Map of Oregon Coast Shipwrecks and Lighthouses by Nancy Lloyd |
|
Lloyd, Nancy |
|
| 1985 |
| LOC:90 |
| $240.00 | Lloyd--Nancy | 1985-Pictorial-Map-of-Oregon-Coast-Shipwrecks-and-Lighthouses-by-Nancy-Lloyd | Illustrated 1985 map of shipwrecks and lighthouses along the Oregon coast, drawn by Nancy Lloyd and published by the Columbia River Maritime Museum, Astoria. Coverage extends from the Columbia River entrance south to Brookings and the California border, with coastal towns, bays, and headlands identified along a narrow strip of pale green land.
<br><br>Numerous wrecks are named and dated in the adjoining Pacific Ocean, often with brief notes identifying vessel types or lives lost. Drawings of sailing ships, steamers, and stranded vessels accompany the entries, with a particularly dense concentration near the Columbia River mouth. Illustrated lighthouses include Tillamook Rock, Heceta Head, Umpqua River, Cape Arago, Coquille River, and Cape Blanco, with dates noted beside them.
<br><br>A decorative title panel contains a sailing-vessel vignette and the museum's imprint, while a small locator inset places Oregon between Washington and California. A printed note specifies that wreck locations are approximate and that only major shipwrecks are shown. Combining maritime history with coastal geography, the map presents a visual record of Oregon's shipwrecks and the lights established along its shores. |
| 8152 |  | Details | Gulf Guaranty Land and Title Company | 1961 |
| Cape Coral Waterfront Real Estate Allocation Map Florida |
|
Gulf Guaranty Land and Title Company |
|
| 1961 |
| LOC:87 |
| $200.00 | Gulf-Guaranty-Land-and-Title-Company | Cape-Coral-Waterfront-Real-Estate-Allocation-Map-Florida | Real estate allocation map issued by Gulf Guaranty Land and Title Company, Cape Coral Division, titled "Allocation Map #81 Revised." Printed in black and blue, the map details numbered building lots, property dimensions, streets, and canals within the Cape Coral development. A manuscript date of 1961 appears in the upper margin; no printed publication date is shown.
<br><br>The enlarged plat includes Genoa Canal S., Genoa Drive, Nightingale Drive, Wonderland Road, S. Park Avenue, and S. Penn Avenue, together with three larger tracts and a designated parking area. Blue waterways emphasize the arrangement of canal-front properties. Red arrows and a blue circle highlight selected parcels, suggesting use in a property sales transaction.
<br><br>An inset at left shows the larger development, with shading locating the section depicted in the main plat. Printed instructions explain how buyers could identify their lots using the two maps. A practical sales document illustrating the subdivision and marketing of Cape Coral waterfront property, retaining manuscript annotations and original fold lines. |
| 8153 |  | Details | Searse, F. W. | 1924 |
| 1924 Flagler Tribune Map of Flagler County, Florida |
|
Searse, F. W. |
|
| 1924 |
| LOC: |
| $365.00 | Searse--F--W- | 1924-Flagler-Tribune-Map-of-Flagler-County--Florida | Detailed map of Flagler County, Florida, issued under the title "The Flagler Tribune Map" and compiled in the office of F. W. Searse, Bunnell, Florida, dated January 1924. Printed in black with red overprinting, the map shows county commissioners' districts, special school districts, drainage districts, roads, railroads, and waterways against a numbered township-and-section grid.
<br><br>The map extends from the Atlantic coast westward to Crescent Lake, identifying Bunnell, Flagler Beach, Haw Creek, and Lake Disston. Portions of neighboring St. Johns, Putnam, and Volusia counties appear along the margins. Named landholdings include the Dupont Land Company, while irregular grant boundaries interrupt the rectangular survey grid. Red lines distinguish drainage-related features, including the Bimini and Bunnell drainage districts.
<br><br>Prepared for general reference, the map combines local transportation and settlement information with the administrative boundaries governing schools, county representation, and drainage. A useful record of Flagler County's landscape and land organization in 1924, with a mileage scale, compass rose, and explanatory legend. |
| 8155 |  | Details | Anonymous | 1969 |
| Edison's Birthday Light Feast - Light Sound Dimension Psychedelic Poster |
|
Anonymous |
|
| 1969 |
| LOC:87 |
| $1,300.00 | Anonymous | Edison-s-Birthday-Light-Feast---Light-Sound-Dimension-Psychedelic-Poster | Colorful psychedelic poster advertising "Edison's Birthday" and a "13 Day Light Feast," February 11-23 [1969] , at Light Sound Dimension, 1572 California Street near Polk, San Francisco. The program promises two different improvised concerts nightly, with Fred Marshall, Jerry Granelli, Noel Jewkes, Bill Ham, Bob Fine, and Bev Bivens Marshall appearing "alive and writhing behind the giant screen."
<br><br>The design combines blue, yellow, magenta, and black in a large cartoon image of an open mouth biting into an electric light bulb. A speech balloon carries critic Phil Elwood's endorsement, "Still the Best Light Show," followed by "Chomp!" Flowing lettering and densely patterned colors reinforce the advertised combination of projected light and improvised music. A stream-of-consciousness passage across the lower margin describes the audience's sensory experience in a darkened room.
<br><br>Admission is listed at $2 general, $1.50 for students, and $1 on Mondays. An example of San Francisco's psychedelic performance advertising, promoting an immersive light-and-sound presentation with the visual language of underground comics. |
| 5451 | 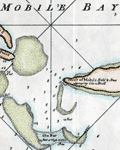 | Details | Sayer, Robert and Bennett, John | 1896 |
| Antique Chart of the Entrance to Mobile Bay, Alabama 1788 [1896] |
|
Sayer, Robert and Bennett, John |
|
| 1896 |
| LOC:78 |
| $225.00 | Sayer--Robert-and-Bennett--John | Antique-Chart-of-the-Entrance-to-Mobile-Bay--Alabama-1788-[1896] | Color-highlighted 1896 photolithographic reproduction of "A Draught of the Entrance of Mobile," surveyed aboard the King's ship Nautilus in 1764 and published in London by Robert Sayer in 1768. The chart depicts the entrance to Mobile Bay, with Dauphine Island, Guillori Island, Pelican Island, and the opposing Point of Mobile.
<br><br>
Numerous depth soundings, shoals, and intersecting rhumb lines document the approaches to the bay. An annotation identifies the entrance bar as having "15 Feet at High water," while other notes describe breakers near Pelican Island and the steep shoreline at Point of Mobile. Blue and yellow coloring distinguishes the shorelines and shallow banks.
<br><br>
Produced by Andrew B. Graham, Photo-Lithographer, Washington, D.C., the sheet bears a reproduced manuscript endorsement stating that it accompanied a report for the fiscal year ending June 30, 1896, signed by a major of the U.S. Army Engineers. Numbered "Eng 54 2" in the lower margin. This is a late nineteenth-century reproduction documenting an eighteenth-century survey, rather than an original 1768 impression. |
| 8129 |  | Details | Armstrong and Company | 1889 |
| Trade card Hingham Hull and Downer Landing Steamboat Company |
|
Armstrong and Company |
|
| 1889 |
| LOC:14 |
| $110.00 | Armstrong-and-Company | Trade-card-Hingham-Hull-and-Downer-Landing-Steamboat-Company | Color lithographed promotional trade card and time-table for the Hingham, Hull and Downer Landing Steamboat Company, issued for the season of 1889. Advertises steamers departing from Rowe's Wharf, Boston, for Pemberton, Hull, Strawberry Hill, Downer Landing, Hingham and Nantasket Beach, with connections to the Nantasket Beach Railroad, operated by the Old Colony Railroad.
<br><br>
The illustrated cover features Hotel Pemberton overlooking the shore, with visitors strolling along the beach. Decorative lettering and ribbon banners promote the combined boat-and-rail route to Point Allerton, Kenberma, Strawberry Hill, Surfside, Ocean House and Nantasket Beach. Lithographed by Armstrong & Co., Boston, the brochure documents the steamboat and railroad services that brought Boston excursionists to the South Shore's seaside resorts during the late nineteenth century. |
| 8122 |  | Details | U.S. Coast and Geodetic Survey | 1852 |
| US Coast Survey Chart of the Passes of the Mississippi River Delta Louisiana |
|
U.S. Coast and Geodetic Survey |
|
| 1852 |
| LOC: |
| $250.00 | U-S--Coast-and-Geodetic-Survey | US-Coast-Survey-Chart-of-the-Passes-of-the-Mississippi-River-Delta-Louisiana | U.S. Coast Survey nautical chart of the principal entrances to the Mississippi River, published in 1852 under Superintendent A. D. Bache. Titled "Reconnoissance of the Passes of the Delta of the Mississippi, Louisiana," the chart records changes since 1839, based on work conducted under Lieutenant B. F. Sands of the U.S. Navy.<br><br>Separate plans depict South West Pass, Garden Island Bay, and the eastern mouths around Blind Bay, including Pass a Loutre, North East Pass, and South Pass. Numerous depth soundings, shoals, offshore bars, and coastal outlines document the shifting approaches through which vessels entered the river. A smaller "Sub-Sketch" places these entrances within the broader Mississippi delta.<br><br>Sailing directions accompany the plans, providing practical guidance for navigating the river mouths. The chart documents the changing geography of the delta and the navigational obstacles facing shipping bound for New Orleans in the mid-nineteenth century. |
| 8123 |  | Details | Vincent, H.S. | 1901 |
| Black Hills Copper Company Mine Workings, Deadwood, South Dakota |
|
Vincent, H.S. |
|
| 1901 |
| LOC:90 |
| $200.00 | Vincent--H-S- | Black-Hills-Copper-Company-Mine-Workings--Deadwood--South-Dakota | Original mining engineering blueprint dated May 1901, showing the workings of the Black Hills Copper Company at Deadwood, South Dakota. A plan and accompanying section record the arrangement of underground workings and their relationship to the surface and mineral vein. Shafts, branching passages, survey bearings, and geological features are shown at a scale of 1 inch to 100 feet.
<br<br>
Prepared during the development of mining in the Black Hills, the drawing documents the practical surveying and engineering work behind copper exploration in a district better known for gold. The blueprint bears the credit of H. S. Vincent, U.S. Deputy Mineral Surveyor, Denver, Colorado. |
| 8124 |  | Details | Anonymous | 1915 |
| Old Colony R. R. Co. Lines owned 1915 Blueprint |
|
Anonymous |
|
| 1915 |
| LOC:90 |
| $100.00 | Anonymous | Old-Colony-R--R--Co--Lines-owned-1915-Blueprint | Blueprint map of the Old Colony Railroad Company's lines in southeastern Massachusetts and Rhode Island, titled "Old Colony R. R. Co. Lines owned June 30, 1915." The network extends through the Boston area southward to Plymouth, New Bedford, Fall River, and Newport, and across Cape Cod to Provincetown, with branches to Woods Hole and Hyannis.<br><br>Railroad routes appear as prominent white lines against the blue ground, with towns, junctions, and coastal features identified. Massachusetts Bay, Cape Cod Bay, and Buzzards Bay provide geographic context. The simplified layout emphasizes the company's interconnected routes and coastal terminals, documenting the extent of its railroad holdings as of the stated date. |
| 8125 |  | Details | Heldway, J. | 1831 |
| Hand-colored statistical map of Somerset, England |
|
Heldway, J. |
|
| 1831 |
| LOC:90 |
| $150.00 | Heldway--J- | Hand-colored-statistical-map-of-Somerset--England | Lithographed statistical map of Somerset from the early 1830s, combining county geography with population figures and information on criminal justice administration. Colored divisions are labeled with principal towns, including Bath, Wells, Taunton, Bridgwater, Frome, and Yeovil. The Bristol Channel and neighboring counties provide geographic context.<br><br>Population and trial figures appear within the mapped divisions, while surrounding tables and notes compare prisoners, expenses, and the operation of the county's assizes and quarter sessions. Particular attention is given to the eastern and western divisions, the county gaol, and the distances associated with holding proceedings at different towns. An unusual thematic map documenting the relationship between geography, population, and the administration of justice in nineteenth-century Somerset. |
| 8126 |  | Details | Schenk, Pieter | 1702 |
| Bird's-Eye View of Toulon Harbor and Fortifications |
|
Schenk, Pieter |
|
| 1702 |
| LOC:90 |
| $275.00 | Schenk--Pieter | Bird-s-Eye-View-of-Toulon-Harbor-and-Fortifications | Engraved bird's-eye view of Toulon, France, published by Pieter Schenk ca. 1702, showing the fortified Mediterranean port and its surrounding hills. The city's angular defensive walls and harbor basins appear at the head of the roadstead, while coastal forts and batteries guard the approaches. Sailing vessels occupy the harbor, and clouds of cannon smoke emphasize the port's military character.
<br><br>
An inset map of Provence places Toulon in its regional setting. The main view identifies La Seyne, Fort St. Louis, the Tour de la Grosse, and other coastal defenses, with annotations recording numbers of cannon and mortars. Dutch and French text beneath the image describes Toulon's history, fortifications, and importance as a French naval arsenal. A decorative engraved border encloses the composition. |
| 8121 |  | Details | Bergdahl, Clyde | 1946 |
| Atomic Age pictorial map of Richland, Washington Hanford |
|
Bergdahl, Clyde |
|
| 1946 |
| LOC:86 |
| $995.00 | Bergdahl--Clyde | Atomic-Age-pictorial-map-of-Richland--Washington-Hanford | Unusual early Atomic Age pictorial map of Richland, Washington, by Clyde Bergdahl, dating to circa 1946. This very rare map combines a humorous view of the community and surrounding Columbia River country with a prominent explanation of plutonium production and a red mushroom cloud.<br><br>
Richland expanded rapidly during World War II as the residential community for workers at the nearby Hanford Engineer Works. Part of the Manhattan Project, Hanford produced the plutonium used in the first atomic test at Trinity and in the bomb dropped on Nagasaki in August 1945. Bergdahl's map places the everyday buildings and activities of this purpose-built community within the landscape of atomic production.<br><br>
The illustrated town includes housing, schools, shops, and Kadlec Hospital. Beyond Richland, the Columbia River links the Hanford installations with Priest Rapids and Grand Coulee Dam. Mount Rainier, Badger Mountain, Rattlesnake Mountain, and Horse Heaven appear alongside coyotes, mountain goats, and a wind-blowing face above the arid country labeled "Sage & Sand."<br><br>
At right, a simplified diagram traces the conversion of uranium into plutonium-239, culminating in an atomic explosion. Its placement beside the cheerful townscape offers a revealing expression of local identity in the immediate postwar years, when nuclear achievement became a source of community pride. Signed by Clyde Bergdahl at lower right.
<br><br> |
| 8094 | 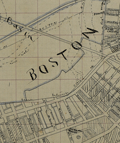 | Details | Fuller and Whitney | 1881 |
| Fuller and Whitney MS Historical Reconstruction of Boston's Back Bay from 1814 to 1871 |
|
Fuller and Whitney |
|
| 1881 |
| LOC: |
| $4,500.00 | Fuller-and-Whitney | Fuller-and-Whitney-MS-Historical-Reconstruction-of-Boston-s-Back-Bay-from-1814-to-1871 | An important group of five original manuscript historical reconstruction maps prepared by the Boston civil engineering firm of Fuller & Whitney, reconstructing Boston’s Back Bay in 1814, 1836, 1851, 1861, and 1871. The manuscripts, drawn circa 1881, correspond to five maps published as blueprints in Fuller & Whitney's 1881 <i>A Set of Plans Showing the Back Bay 1814-1881</i>.<br><br>
<div id="0" align="center">
<a title="Title Page"></a>
<img id="3" src="/ZoomifyImages/SC_8094/FW_Blueprints_Title.jpg" alt="" width="240"/> <br><br>
</div> For example, comparison of the 1814 manuscript with the published blueprint shows closely corresponding shorelines, waterways, roads, boundaries, place names, and topographical details, strongly suggesting that these were original compilation or master drawings prepared for the blueprint series.<br><br>
The maps were prepared retrospectively from earlier maps, surveys, property records, and other sources. The 1814 manuscript and the others, dated August 1881, includes an "Authorities" section identifying sources used in its preparation.<br><br>
Together, the manuscripts record the transformation of the Back Bay. The 1814 map depicts the original tidal landscape of marshes, creeks, islands, and flats. The 1836 map shows changes following construction of the Mill Dam and associated causeways and waterways. The 1851 map records conditions immediately before large-scale reclamation.<br><br>
By 1861, filling operations were advancing westward, with newly created land, streets, and building lots replacing the tidal basin. The 1871 manuscript shows the recognizable Back Bay emerging, with filling substantially advanced, the street grid established, and residential development underway.<br><br>
The manuscripts are also significant in relation to Fuller & Whitney's use of blueprint reproduction. William H. Whitney was an early practitioner of the process in Boston.<br><br> |
| 8113 |  | Details | Brewster, Steven J. | 1985 |
| Scarce pictorial map of Beverly Hills California |
|
Brewster, Steven J. |
|
| 1985 |
| LOC:150 |
| $800.00 | Brewster--Steven-J- | Scarce-pictorial-map-of-Beverly-Hills-California | A colorful pictorial map of Beverly Hills, published by Map America Publishing in 1985. Streets wind through a densely illustrated landscape of shops, restaurants, service stations, and other local businesses, each represented by a small drawing or hand-lettered advertisement. The map names the businesses and often gives their telephone numbers, making it a lively record of Beverly Hills commerce in the mid-1980s.<br><br>
The poster combines a street map with paid local advertising. Its crowded composition rewards close inspection: storefronts, cars, signs, and small figures appear throughout, while a Beverly Hills shield identifies the subject at right. The upper-left corner credits Steven Brewster Jr. as artist and bears the publisher's name and 1985 copyright notice. |
| 8115 |  | Details | Shaw, Suzanne | 1985 |
| Pacific Seacoast Experience A Pictorial Map of Californias Maritime History |
|
Shaw, Suzanne |
|
| 1985 |
| LOC:63 |
| $250.00 | Shaw--Suzanne | Pacific-Seacoast-Experience-A-Pictorial-Map-of-Californias-Maritime-History | A richly illustrated pictorial map of the Pacific coast, drawn by Suzanne Shaw in 1985. Centered on California, <i>Pacific Seacoast Experience</i> combines coastal geography with scenes from maritime history. Sailing ships, sea life, explorers, lighthouses, and historical anecdotes crowd the land and water, inviting the viewer to follow the coast from place to place.<br><br>
Illustrated panels around the border depict notable vessels and lighthouses, while inset maps and text add detail to the main image. Shaw uses the conventions of an old sea chart - an ornamental border, compass rose, and elaborate title cartouche - to present a modern, densely annotated celebration of the Pacific seaboard. |
| 8116 |  | Details | Schleh, Joy and Albert Lorenz | 1992 |
| Pictorial Map A Portrait of Long Island |
|
Schleh, Joy and Albert Lorenz |
|
| 1992 |
| LOC:150 |
| $365.00 | Schleh--Joy-and-Albert-Lorenz | Pictorial-Map-A-Portrait-of-Long-Island | A densely illustrated pictorial map from 1992 titled <i>A Portrait of Long Island</i>, signed "Lorenz-Schleh" by Albert Lorenz and Joy Schleh. Viewed from above, the island stretches from Brooklyn and Queens to its eastern towns, with Long Island Sound to the north and the Atlantic Ocean to the south. Hundreds of drawings identify communities, buildings, beaches, waterways, and other landmarks; Fire Island appears along the south shore.<br><br>
The map's border adds illustrated panels about local places, people, and history. Together with the labeled towns and small scenes across the island, they make the sheet both a map and a portrait of Long Island in the early 1990s. |
| 8110 |  | Details | Scallion, Gordon Michael | 1993 |
| Prophecy map of the future United States |
|
Scallion, Gordon Michael |
|
| 1993 |
| LOC:150 |
| $650.00 | Scallion--Gordon-Michael | Prophecy-map-of-the-future-United-States | A striking example of Gordon-Michael Scallion's "Future Map of the United States: 1998-2001," published by The Matrix Institute in 1993. The map presents Scallion's speculative vision of the United States following catastrophic geological and climatic changes that he predicted would occur near the end of the twentieth century.<br><br> Not laminated.<br><br>
Scallion depicts extensive areas of the country submerged beneath the sea, dramatically altering California and the Pacific Coast, the Mississippi Valley, Great Lakes, Gulf Coast, and Atlantic seaboard. Existing state boundaries and cities remain visible, allowing comparison between familiar geography and his imagined future landscape.<br><br>
Scallion attributed the map to a series of visions beginning in 1979 and predicted earthquakes, rising seas, changes in the Earth's poles, and other upheavals. Although the predicted transformations never occurred, the map is an unusual example of late twentieth-century speculative cartography, reflecting the New Age movement and the environmental and millennial anxieties surrounding the approach of the year 2000.
<br><br> |
| 8112 |  | Details | Weibe, Joan and James | 1972 |
| Austin Texas The Fun-tier Capital of the United States |
|
Weibe, Joan and James |
|
| 1972 |
| LOC: |
| $850.00 | Weibe--Joan-and-James | Austin-Texas-The-Fun-tier-Capital-of-the-United-States | A colorful and exuberant original pictorial map of Austin, Texas, created by Joan and James Wiebe and published by Inter Continental Cartographers in 1972. Entitled "Austin Texas - The Fun-Tier Capital of Texas," the large-format map presents the city through an imaginative bird's-eye view filled with humorous illustrations, local landmarks, businesses, recreational activities, and scenes of everyday Austin life.<br><br>
In retrospect, this scarce map's eccentric humor and crowded cast of characters seem to anticipate the spirit later expressed by the familiar slogan "Keep Austin Weird." Although that phrase was not coined until decades later, the map portrays an Austin already celebrating individuality, humor, local culture, and a certain disregard for convention. Its playful "Fun-Tier Capital" title and offbeat imagery offer an early visual expression of the distinctive personality that would eventually become closely associated with the city.<br><br>
The map combines recognizable geography with hundreds of cartoon-like vignettes, transforming Austin into a lively visual portrait of the city during the early 1970s. Roads, neighborhoods, waterways, and prominent locations provide the geographic framework, while whimsical figures and buildings emphasize the city's entertainment, university, commercial, and outdoor culture. A broad simulated wood-grain border reinforces the map's distinctly period appearance.<br><br>
Measuring approximately 40 x 30 inches, the map is an uncommon example of the large pictorial promotional maps produced for American cities during the postwar period. Its playful "Fun-Tier" title and dense imagery capture Austin at an important moment in its development, just as the city was beginning to acquire the cultural identity and rapid growth that would characterize the following decades.<br><br> |
| 8106 |  | Details | Silicon Maps Inc. | 2009 |
| 2009 Map of Silicon Valley |
|
Silicon Maps Inc. |
|
| 2009 |
| LOC:63 |
| $300.00 | Silicon-Maps-Inc- | 2009-Map-of-Silicon-Valley | A calendar map of Silicon Valley California from 2009 by Silicon Maps, Inc. |
| 8107 |  | Details | Cook and Cook Ltd. | 1990 |
| Lake Michigan Graveyard of the Great Lakes Major Wrecks Since 1600 AD |
|
Cook and Cook Ltd. |
|
| 1990 |
| LOC:150 |
| $195.00 | Cook-and-Cook-Ltd- | Lake-Michigan-Graveyard-of-the-Great-Lakes-Major-Wrecks-Since-1600-AD | Original 1990 blueprint-style decorative pictorial map of Lake Michigan devoted to the remarkable concentration of shipwrecks lying beneath its waters. An unusually detailed late twentieth-century pictorial record of Lake Michigan's maritime history, combining cartography, shipwreck history, lighthouse imagery, and Great Lakes folklore.
<br><br>
The lake is densely populated with individually identified vessels, many accompanied by their dates and circumstances of loss, illustrating more than three centuries of maritime disasters involving schooners, steamships, freighters, passenger vessels, and other craft.
The map is surrounded by nautical imagery and historical vignettes highlighting notable wrecks and legends of Lake Michigan, including the Griffin of 1679, the passenger liner Eastland, the "Christmas Tree Ship" Rouse Simmons, the Alpena, and accounts of aircraft and vessels that disappeared on the lake. Prominent Lake Michigan lighthouses are also illustrated, including White Shoal, Potawatomi, Point Betsie, North Point, Wind Point, Grand Haven, and Old Michigan City. A ship legend identifies the different vessel types represented on the map.
<br><br>Published by Cook & Cook Ltd. of St. Marie, Michigan, with a 1989 copyright date and a 1990 revised edition. |
| 8109 |  | Details | Scudder, Kirby | 1989 |
| The World of C3I Pictorial Map of the Cold War Defense and Computer Industry |
|
Scudder, Kirby |
|
| 1989 |
| LOC:150 |
| $500.00 | Scudder--Kirby | The-World-of-C3I-Pictorial-Map-of-the-Cold-War-Defense-and-Computer-Industry | Unusual pictorial map of the international defense electronics and computer industry during the late Cold War. Titled <i>The World of C3I</i>, the map illustrates the companies and government organizations involved in command, control, communications and intelligence (C3I), arranged within a fanciful landscape extending across the United States to Europe and Israel where west (California) is located at bottom..
<br><br>More than thirty defense, aerospace, communications and computer companies are identified by their corporate buildings and logos, including IBM, AT&T, Raytheon, Honeywell, Digital Equipment Corporation, Data General, Hughes Aircraft, McDonnell Douglas, Rockwell International, Siemens, Philips, Thomson-CSF and Tadiran. The Pentagon and CECOM are also represented, while satellites, aircraft, ships and communications installations reinforce the map's military and technological theme.<br><br>The map was produced as a promotional piece for Apollo Computer, whose facility appears prominently in the northeastern United States. The advertising slogan along the lower margin, "Go End-To-End with Apollo - the Secure Solution," promotes Apollo's computer systems to the defense and government market.
<br><br>An interesting artifact of the rapidly developing computer and defense industries of the period, the map provides a visual record of the companies participating in the C3I market at the time. Many of the firms represented were subsequently absorbed through mergers and acquisitions, making the map an evocative snapshot of the technology and defense establishment near the end of the Cold War.
<br><br> Copyright 1987 Pacific Ventures. |
| 8100 | 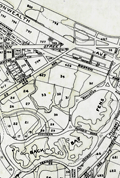 | Details | Whitney, William H. | 1888 |
| William H. Whitney's Engineer's Trace Map of Boston's Back Bay, 1888 |
|
Whitney, William H. |
|
| 1888 |
| LOC:68 |
| $3,500.00 | Whitney--William-H- | William-H--Whitney-s-Engineer-s-Trace-Map-of-Boston-s-Back-Bay--1888 | An original manuscript pen and ink engineering trace by Boston civil engineer William H. Whitney, titled <i>Plan of Back Bay Showing Improvements on Streets and Estates from Latest Surveys</i>, dated July 1, 1888. Prepared from Whitney's offices at 39 Court Street, Boston, the large-scale plan provides a detailed record of the Back Bay and adjoining districts near the completion of the great nineteenth-century program of land reclamation and urban development.
<br><br>
The map extends from the Public Garden and established Back Bay westward across the Charles River frontage, Commonwealth Avenue and the developing lands beyond Massachusetts Avenue, while extending south through Roxbury and the adjoining districts.
<br><br>Of particular interest is the detailed treatment of the Back Bay Fens and Muddy River, shown while Frederick Law Olmsted's plans for Boston's emerging park system were being implemented. Beginning in 1878, Olmsted sought to transform the polluted tidal marsh into a carefully engineered landscape that combined drainage and sanitary improvements with naturalistic park design. The Fens became the first major component of the interconnected system later known as Boston's Emerald Necklace.
<br><br>
The trace is closely related to the 1881
<a href="https://www.rarecharts.com/ShowDetail/Creator/Fuller-and-Whitney/Title/Original-Engineering-Traces-for-Fuller-and-Whitney-s-Historical-Plans-Boston-s-Back-Bay-1814-1882/8095" target="_blank">Fuller & Whitney historical reconstruction engineering plans </a>documenting the development of the Back Bay from 1814-1881.
By 1888 Whitney was working under his own name, although from the same 39 Court Street address formerly associated with Fuller & Whitney. As an original engineering trace rather than a later printed map, the sheet provides a detailed working record of the continuing surveying, property development, and physical transformation of Boston's Back Bay during the late nineteenth century. |
| 8095 | 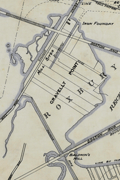 | Details | Fuller and Whitney | 1881 |
| Original Engineering Traces for Fuller and Whitney's Historical Plans Boston's Back Bay 1814-1882 |
|
Fuller and Whitney |
|
| 1881 |
| LOC: |
| $21,500.00 | Fuller-and-Whitney | Original-Engineering-Traces-for-Fuller-and-Whitney-s-Historical-Plans-Boston-s-Back-Bay-1814-1882 | An important group of six original pen and ink engineering trace drawings on tracing cloth by the Boston civil engineering firm of Fuller & Whitney, from 1881 and 1882, depicting the development of the Back Bay in 1814, 1836, 1851, 1861, 1871, and 1882. The first five correspond closely to the historical plans published as blueprints in Fuller & Whitney's 1881 <i>A Set of Plans Showing the Back Bay 1814-1881</i>.<br><br>
<div id="0" align="center">
<a title="Title Page"></a>
<img id="3" src="/ZoomifyImages/SC_8094/FW_Blueprints_Title.jpg" alt="" width="240"/> <br><br>
</div> The final trace depicts the Back Bay in 1882, rather than 1881 as in the published series, suggesting that the firm's working drawings continued to be revised following publication. Executed on translucent tracing material, the six drawings illustrate successive stages in the engineering and urban development of the Back Bay.
<br><br>Beginning with the largely undeveloped waterfront of 1814, the sequence traces the construction of the Mill Dam and its associated infrastructure by 1836, the changing configuration of the basin in 1851, and the expanding network of reclaimed land, streets, and building lots depicted in the 1861 and 1871 plans.
The final 1882 plan, titled , presents the developed street grid, Commonwealth Avenue, remaining waterways and marshes, property divisions, and other improvements.
<br><br>
The close correspondence between these traces and the published Fuller & Whitney blueprints strongly suggests that they were working reproduction drawings or masters associated with production and updating of the blueprint series. Together they preserve an unusual record of both the physical creation of Boston's Back Bay and the engineering and cartographic process used by Fuller & Whitney to document its development.<BR> |
| 8090 |  | Details | Feher, Joseph | 1950 |
| The Dole Map of the Hawaiian Islands |
|
Feher, Joseph |
|
| 1950 |
| LOC:63 |
| $575.00 | Feher--Joseph | The-Dole-Map-of-the-Hawaiian-Islands | Original lithographed pictorial map of the Hawaiian Islands copyrighted by the Hawaiian Pineapple Company Ltd. 1950. Overall width 40.5 inches. Lacking original legend at right. Pinholes in margins.
<br><br>
Artist Joseph Feher depicted the Hawaiian islands and adjacent waters with boats, fish, and typical objects and pursuits associated with the islands: flying fish, surfing, spear fishing, sailing, poi-making, hula dancers, etc. Islands of the State of Hawaii mentioned in the legend include: Kauai, Niihau, Oahu, Molokai, Lanai, Maui, Kahoolawe, and the big island- Hawaii.
<br></br>
This is the second of two "Dole Pineapple Maps", the first was published in 1937.
<br></br>
Lithography by Schwabacher-Frey.
<br></br>
Once known as the Sandwich Islands, the Hawaiian Islands first documented discovery by a westerner occurred in 1778 with the arrival of British explorer Captain James Cook.
<br></br> |
| 8086 |  | Details | Harvey, William Henry | 1868 |
| England as Britannia Pictorial Map from Geographical Fun |
|
Harvey, William Henry |
|
| 1868 |
| LOC:7 |
| $300.00 | Harvey--William-Henry | England-as-Britannia--Pictorial-Map-from-Geographical-Fun | This striking anthropomorphic map of England presents the nation as a crowned female figure seated across the geographic outline of the country, a vivid example of 19th-century allegorical cartography from the celebrated 1868 series Geographical Fun, published in London by William Henry Harvey and lithographed by Vincent Brooks, Day & Son. England is personified as a regal woman wearing a crested helmet and holding a trident-like scepter, her shield emblazoned with the Union flag. Key regions - from the Scottish border to the English Channel - are integrated into her form, blending geography and symbolism. The surrounding seas are labeled, and ins et vignettes, including a naval scene, reinforce England’s maritime identity and imperial reach.<br><br>
Such allegorical maps became especially popular in the Victorian period, when Britain stood at the height of its global influence. The female figure evokes Britannia, the long-standing emblem of British power, naval supremacy, and imperial authority. The inclusion of heraldic devices and martial attributes underscores themes of strength, unity, and dominion.<br><br>
As a collectible object, this map appeals both to cartographic enthusiasts and to collectors of British imperial ephemera. It bridges geography, political symbolism, and popular art, illustrating how maps could function as cultural statements as much as spatial representations. Allegorical maps of this type are increasingly sought after for their visual charm, historical resonance, and their embodiment of Victorian self-image at a moment when England perceived itself as ruling both land and sea. |
| 8087 |  | Details | Harvey, William Henry | 1868 |
| Anthropomorphic map of Scotland |
|
Harvey, William Henry |
|
| 1868 |
| LOC:7 |
| $300.00 | Harvey--William-Henry | Anthropomorphic-map-of-Scotland | Allegorical anthropomorphic map of Scotland from the celebrated 1868 series Geographical Fun, published in London by William Henry Harvey and lithographed by Vincent Brooks, Day & Son, with designs attributed to Lilian Lancaster. Here Scotland is cleverly transformed into a Highland piper striding across the nation’s outline, his kilt and plaid integrated into the Lowlands and Borders while the rugged Highlands form his bent back and shoulders. The Hebrides scatter offshore at left, and major firths and cities remain labeled, blending recognizable geography with spirited caricature.<br><br>
The figure embodies Victorian notions of Scottish identity: martial, romantic, and resolutely Highland. His bagpipes extend across the eastern coast, visually merging national instrument and coastline, while tartan stockings and bonnet reinforce the era’s popular imagery of Scotland as a land of clans, heroes, and misted hills. The juxtaposition of cartographic precision and humorous exaggeration reflects the mid-19th century fascination with anthropomorphic maps, which served both as entertaining novelties and as subtly patriotic expressions within the broader culture of the British Isles.<br><br>
Printed in vibrant chromolithography, the sheet exemplifies the technical skill of London’s leading lithographic houses during the height of the Victorian print trade. Though playful in tone, it preserves a surprising amount of geographic detail, making it as engaging for the map enthusiast as for the collector of pictorial or satirical cartography. Today the Scotland sheet remains one of the most visually striking images from the series, prized for its bold color, imaginative composition, and evocative rendering of national character. |
| 8085 |  | Details | Beech-Nut Packing Company | 1941 |
| Persuasive Map of Beech Nut Gum Radio Advertising |
|
Beech-Nut Packing Company |
|
| 1941 |
| LOC:90 |
| $350.00 | Beech-Nut-Packing-Company | Persuasive-Map-of-Beech-Nut-Gum-Radio-Advertising | Unrecorded large-format persuasive advertising map of the United States issued by Beech-Nut for the 1941-1942 radio season, boldly presenting the company’s national broadcast coverage. The country is rendered in bright yellow, overprinted with station call letters in red, while surrounding text proclaims that Beech-Nut advertising combines Red, Columbia, Blue, and Mutual stations "not possible to obtain on any single network." The sheet emphasizes scale and power, noting 172 stations, 38 of them 50,000-watt outlets, and nearly 1,000 Beech-Nut Gum and Beechies ads every week. The result is a striking visual inventory of American radio geography on the eve of World War II.<br><br>
The language makes clear that this was not intended for the general public. Instead, it was designed to persuade wholesalers, grocery chains, druggists, and regional distributors that Beech-Nut’s campaign reached every part of the country at night when radio audiences were largest. By highlighting 50,000-watt clear-channel stations in red and stressing multi-network placement, the map argues that Beech-Nut’s coverage exceeds what any single network could provide. It is, in effect, a sales instrument aimed at convincing the trade that consumer demand was being nationally manufactured and that retailers should stock accordingly.<br><br>
As an artifact, the piece documents a transitional moment in American broadcast advertising, when sponsors strategically assembled cross-network station lists to maximize reach. The map translates invisible airwaves into cartographic form, making corporate media strategy tangible. Combining commercial ephemera with radio history, it stands as an unusual and compelling intersection of cartography, marketing, and early 1940s national media infrastructure. |
| 8079 | 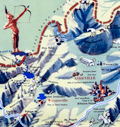 | Details | Sink, John | 1948 |
| Scarce pictorial map of western North Carolina |
|
Sink, John |
|
| 1948 |
| LOC:41 |
| $450.00 | Sink--John | Scarce-pictorial-map-of-western-North-Carolina | Western North Carolina: a vacationist's map and guide is a colorful mid-20th century pictorial map ca. 1948 illustrated by John Sink, a commercial artist known for lively regional tourist imagery. The map presents the Blue Ridge and Great Smoky Mountains as a continuous mountain chain extending from the Tennessee line eastward across western North Carolina ending at the Sauratown Mountains with Hanging Rock State Park.<br><br>
Peaks, gaps, and valleys are shown in bold, sculptural relief, while towns such as Asheville, Boone, and Bryson City anchor the geography. Cartoon figures hiking, skiing, fishing, and sightseeing animate the landscape, emphasizing recreation and leisure ("The Fun") rather than precise navigation.<br><br>
Designed as both a guide and a promotional image, the map combines expressive illustration with practical travel information. Major highways and scenic routes, including the Blue Ridge Parkway, trace the mountain ridges, while airplanes, automobiles, and roadside signage reflect the postwar rise of leisure travel by car and air. An inset conventional road map ("The Hiways") at lower right shows a detailed network of highways serving western North Carolina, reinforcing the sheet's function as both a souvenir image and a usable tourist guide.
<br><br>Text on verso with twelve proposed routes for scenic tours throughout the region. |
| 8077 | 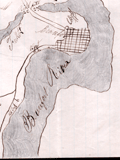 | Details | Unknown Union Source | 1862 |
| The Port Royal Experiment Manuscript Civil War Map Beaufort SC |
|
Unknown Union Source |
|
| 1862 |
| LOC:68 |
| $4,500.00 | Unknown-Union-Source | The-Port-Royal-Experiment-Manuscript-Civil-War-Map-Beaufort-SC | This Civil War–era manuscript map of Beaufort, South Carolina and its surrounding waterways documents the region at the birth of Reconstruction ca. 1862. The map is perhaps the earliest record during what became known as the <b>Port Royal Experiment</b>, when Union occupation, emancipation, and continued military conflict unfolded at the same time. The map shows inland roads, ferries, and navigable rivers, identifies numerous named plantations, and records Union and Confederate picket positions, defensive rifle pits near Beaufort, the battlefield at Port Royal Ferry, and notations of Confederate shelling. It reflects a landscape under Union control but still actively contested.<br><br>The most striking feature of the map is the large number of plantations recorded and the size of the text used to describe plantation ownership vs the military detail. After Union forces captured the Beaufort area in late 1861, most plantation owners fled, leaving more than ten thousand emancipated Gullah people on intact estates without pay, supplies, or legal protection. Beginning in 1862, Northerners arrived to address immediate problems: preventing starvation, organizing paid work, starting schools, and safeguarding newly won freedom for the formerly enslaved. For teachers, missionaries, Treasury agents, and Army officers, a map like this was a working tool. It showed where people lived, where food and cotton were stored, how plantations were connected by roads and waterways, and which routes could be traveled with relative safety. |
| 8064 | 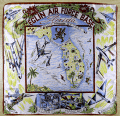 | Details | Anonymous | 1959 |
| Mid century scarf Eglin Air Force Base Florida |
|
Anonymous |
|
| 1959 |
| LOC: |
| $365.00 | Anonymous | Mid-century-scarf-Eglin-Air-Force-Base-Florida | This scarce and colorful mid-20th-century souvenir textile celebrates Eglin Air Force Base, Florida, presenting the installation as a principal proving ground of American air power during the early Cold War. A pictorial map of Florida labeled “Air Proving Ground Command” anchors the design, surrounded by illustrations of jet aircraft, test pilots, target vehicles, and specialized facilities. The textile combines cartographic imagery with promotional aviation art, adapting a souvenir-scarf format widely used for U.S. Air Force bases in the 1950s.<br><br>
The aircraft depicted represent the forefront of U.S. Air Force technology in the supersonic transition era. Shown at mid-left is a B-52 Stratofortress, identifiable by its long straight wings and eight-engine configuration, symbolizing strategic bomber testing. At upper left appears a Lockheed F-104 Starfighter, recognizable by its needle-like fuselage and extremely short wings, while at upper right is a Convair F-102 Delta Dagger, distinguished by its pure delta wing and nose intake. Also depicted is a Republic F-84F Thunderstreak, a swept-wing fighter-bomber widely used in weapons and systems evaluation during the mid-1950s. Additional imagery of test pilots and supersonic tow targets reinforces Eglin’s testing mission.<br><br>
The dating of the textile is supported by both the aircraft selection and the prominent reference to the Climatic Hangar, a facility completed at Eglin in 1954 and widely promoted in subsequent years for extreme-environment testing. The inclusion of the F-102, operational from 1956, and the F-104, which entered U.S. Air Force service in 1958, establishes a firm late-1950s timeframe, while the F-84F reinforces a mid-to-late 1950s context. The absence of later aircraft types or space-age imagery associated with the 1960s further supports an early Cold War date. These elements place the textile most convincingly in the late 1950s, circa 1958 to 1960.<br><br> |
| 8060 | 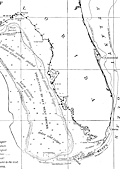 | Details | Goode, G. Brown | 1887 |
| Late 19th Century Map of Gulf Coast Fishing Grounds |
|
Goode, G. Brown |
|
| 1887 |
| LOC:87 |
| $165.00 | Goode--G--Brown | Late-19th-Century-Map-of-Gulf-Coast-Fishing-Grounds | An early federal fisheries chart of the northern Gulf of Mexico titled <i>Fishing Grounds of the Gulf Coast of the United States</i> (Chart No. 16), covering the coast from the Mississippi Delta and Mobile Bay east to the Florida Keys and Cape Canaveral. The map plots depth soundings in fathoms and outlines key offshore banks and ledges, with dotted boundaries marking the reported limits of the red snapper and grouper fishing grounds. Notes identify the operating ranges of Gulf fishing smacks and indicate principal fishery localities along the shore, capturing a working geography of the region at the height of nineteenth century commercial sail fisheries.<br><br>
Issued as part of the U.S. Fish Commission publication <i>The Fishery Industries of the United States</i> (Section III), the sheet is significant as an early attempt to translate fishermen's local knowledge into a standardized, survey-like document. It helped define where high value reef and bottom fisheries were concentrated relative to depth and distance offshore, information central to the expansion of long range Gulf fishing and the emerging national seafood trade. Today it also serves as a baseline record of fishing grounds and practices before twentieth century industrialization, making it valuable for historians of American maritime economy and for long term environmental comparison.
<br><br>
"The Fishery Industries of the United States". 1887. Section 3. Page 62.<br><br> |
| 8058 | 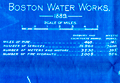 | Details | Boston Water Board | 1889 |
| Boston Water Works Blueprint Plan 1889 Sudbury Cochituate Mystic Water Supply Diagram |
|
Boston Water Board |
|
| 1889 |
| LOC:41 |
| $375.00 | Boston-Water-Board | Boston-Water-Works-Blueprint-Plan--1889-Sudbury-Cochituate-Mystic-Water-Supply-Diagram | |
| 8053 | 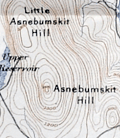 | Details | Appalachian Mountain Club | 1891 |
| Map of the Country About Worcester Compiled by Appalachian Mountain Club |
|
Appalachian Mountain Club |
|
| 1891 |
| LOC: |
| $1,100.00 | Appalachian-Mountain-Club | Map-of-the-Country-About-Worcester-Compiled-by-Appalachian-Mountain-Club | A scarce regional map of central Massachusetts titled <i>Map of the Country About Worcester</i>, published in 1891 by the Appalachian Mountain Club. The map is a sister publication to the Club’s <i>Map of the Country About Boston</i>, issued a year earlier in 1890, and extends AMC coverage westward from the Boston basin into the uplands and river valleys of interior Massachusetts. Only six institutional holdings are recorded in WorldCat, underscoring the map’s scarcity.<br><br>
The maps were compiled from multiple U.S. Geological Survey quadrangle sheets and reduced to a uniform scale. Together, the two sheets extend the Appalachian Mountain Club’s regional mapping beyond the Boston basin into central Massachusetts. Their production reflects the Appalachian Mountain Club’s effort to adapt official government mapping into practical regional maps suitable for recreational, educational, and reference use.<br><br>
The Worcester map appeared in 1891, the same year that <i>The Trustees of Public Reservations</i> was founded, marking a pivotal moment in Massachusetts conservation history. Both initiatives were closely associated with Charles Eliot, an early member of the Appalachian Mountain Club who became its Councilor of Topography in 1890 and was a leading advocate for systematic landscape preservation.<br><br>
As stated in the imprint, the map was “Published by the Appalachian Mountain Club from the proofs of the State map with the permission of the director of the United States Geological Survey and the Commissioners of the Topographic Survey of Massachusetts.” The sheet was lithographed by George S. Harris and Sons, with sales agents W. B. Clarke and Company of Boston and Putnam and Davis, Booksellers, Worcester. |
| 8052 | 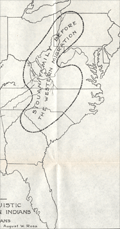 | Details | Connelley, William Elsey | 1920 |
| Lot of two maps Caddoan and Siouan Homelands and Westward Migration |
|
Connelley, William Elsey |
|
| 1920 |
| LOC: |
| $195.00 | Connelley--William-Elsey | Lot-of-two-maps-Caddoan-and-Siouan-Homelands-and-Westward-Migration | Two scarce maps pertaining to the Siouan and Caddoan linguistic families by William E. Connelley. Drawn by August Ross, the maps were published circa 1920.
<br><br>
The first map, titled Map Showing The Possessions Of The Caddoan And Siouan Linguistic Families Of North American Indians Before The Western Migration Of The Siouan's, presents a continental synthesis intended to depict original linguistic homelands rather than fixed political boundaries. The Caddoan family is shown occupying a Mississippi Valley core along the Arkansas, Red, and Platte river systems, while the Siouan family is placed mainly east of the Mississippi River. The enclosed regions represent long-term habitation zones derived from historical tradition, early European accounts, and linguistic comparison. The map establishes the argument that the Siouan peoples were later arrivals to the Plains, displacing an older Caddoan presence.
<br><br>
The second map, Map Showing The Original Caddoan Country After The Intrusion Into It Of The Siouan Linguistic Family, emphasizes movement and territorial contraction. Numbered regions and migration paths depict successive Siouan advances and the resulting fragmentation of Caddoan lands, isolating groups such as the Pawnee and Arikara. River corridors remain central, reinforcing the idea that waterways structured settlement and conflict. In contrast to the first map’s generalized homelands, this sheet focuses on process, showing encroachment, displacement, and the later imposition of reservation boundaries.<br><br> |
| 8047 | 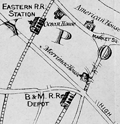 | Details | Little, N. Jr. | 1875 |
| Map of mining lands at Newbury, near Newburyport, Essex County, Massachusetts |
|
Little, N. Jr. |
|
| 1875 |
| LOC:41 |
| $950.00 | Little--N--Jr- | Map-of-mining-lands-at-Newbury--near-Newburyport--Essex-County--Massachusetts | An original late 19th century survey map titled "Map of Mining Lands at Newbury, Near Newburyport, Essex County, Massachusetts", formally entered according to Act of Congress in 1875. Issued separately in a small covered booklet. Drawn by N. Little Jr., the sheet presents a large-scale depiction of the marshlands, waterways, and adjoining uplands of the lower Merrimack and Parker River region. Not much is known about Little but several parcels of land on the map are attributed to N. Little Jr. making the author a very interested stakeholder in the maps' creation and publication.
<br><br>
Executed at a scale of 125 rods to one inch, the map delivers a level of practical detail associated with cadastral and engineering surveys rather than general town mapping. A decorative compass rose anchors the composition at left, while clearly defined town boundaries identify West Newbury, Newbury, Rowley, and Georgetown, with Newburyport situated prominently along the Merrimack River corridor.<br><br>
The map is especially informative in its integration of natural geography, transportation infrastructure, and parcel-level land division. The Merrimack River spans the upper portion of the sheet with the Newbury Flats labeled along the riverfront, while the eastern extent reaches to the Plum Island River, Plum Island, and the Atlantic Ocean, including Salisbury Beach. The Parker River winds through the lower right quadrant, fed by numerous named creeks and surrounded by finely stippled marshland drainage. Two railroad lines, the Eastern Railroad and the Boston and Maine Railroad, are clearly drawn and labeled, reinforcing the economic context of the survey. Throughout the central and southwestern areas, dense subdivision lines and owner-name annotations document individual parcels within the designated mining lands, confirming the map’s function as a legal and developmental instrument rather than a purely descriptive view of the region.<br><br> |
| 8044 |  | Details | Davis, G. H. | 1938 |
| A scarce original pre-war pictorial map of Singapore |
|
Davis, G. H. |
|
| 1938 |
| LOC: |
| $900.00 | Davis--G--H- | A-scarce-original-pre-war-pictorial-map-of-Singapore | A rare original pictorial map of Singapore and its environs, published in The Illustrated London News on February 12, 1938, titled "The Empire's New [GBP] 17,000,000 Strategic Base in the East: Singapore, Its Docks and Aerodromes." Drawn by G. H. Davis for the ILN, the map presents a richly detailed bird's-eye rendering of the island at the moment when Britain's massive naval base at Sembawang was nearing completion. Relief is shown pictorially, with hills, mangrove swamps, plantations, reservoirs, roads, railways, airfields, and coastal defenses all carefully delineated. The Johore Strait, Main Strait, and surrounding waterways are prominently emphasized, underscoring Singapore's strategic position astride the main sea routes between the Indian Ocean and the South China Sea. An inset map at lower right situates Singapore within Southeast Asia, reinforcing its imperial importance as a keystone of British naval power.
The accompanying text explains the military and imperial context in detail, describing the combined roles of the Army, Navy, and Air Force, the opening of the 1,000-foot graving dock in February 1938, and the enormous scale of the investment in docks, aerodromes, batteries, and infrastructure. Particular attention is given to the naval base's capacity to service capital ships, the airfields at Seletar and elsewhere, and the integration of Singapore into Britain's wider Far Eastern defense system. Published just months before the mounting crises of the late 1930s, the map captures British strategic confidence at its peak, only a few years before the fall of Singapore in 1942 would dramatically alter imperial assumptions. As a contemporary visual document, it stands as both a striking example of interwar news illustration and a powerful artifact of prewar geopolitical planning in the Far East. |
| 8041 | 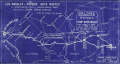 | Details | Hall, Dick Wick | 1920 |
| Rare Salome Road Map by Dick Wick Hall Los Angeles to Phoenix |
|
Hall, Dick Wick |
|
| 1920 |
| LOC:89 |
| $1,450.00 | Hall--Dick-Wick | Rare-Salome-Road-Map-by-Dick-Wick-Hall-Los-Angeles-to-Phoenix | Very rare unrecorded, hand-drawn road map, issued as a blueprint, of central Arizona and California, west of Phoenix by promoter, humorist, publisher, columnist and entrepreneur Dick Wick Hall. Inset note for aviation landing fields, rare on road maps of this era. Hall's initials D.W.H. at bottom right corner.
<br><br>
<div id="0" align="center">
<a title=""></a>
<img id="8041" src="/ZoomifyImages/SC_8041/SC_8041_Frog.jpg" alt="Dick Wick Hall's Famous Salome Frog." width="300"/> <br><br> <font size="-2">Hall's Famous Salome Frog<br> At the Laughing Gas Station. Salome AZ.</font>
</div><br>
Dick Wick Hall founded Salome, Arizona in 1904 as part of a speculative desert development venture along a proposed railroad route in western Arizona. He soon became the town’s most visible booster, operating a roadside service station, promoting travel through the desert, and cultivating a larger-than-life persona that blended entrepreneurship with humor.
<br><br>
Dated to 1920 based on a very similar map published by Hall in his Salome Sun mimeographed newspaper he published between 1920 and 1926. <div class="indenttextblock"><i>" ... the paper was likely intended to be supplied to service stations, such as the one Hall owned in Salome, or other road stops for the traveler passing through, as each issue contains short quips written by Hall about road trips, Yuma County, stories about the desert and driving in the southwest. The paper also often contains cartoonish illustrations of common southwest wildlife, from snakes to scorpions and cacti, as well as regularly featuring a cartoon frog by the name of the Salome Frog who regularly declares that he cannot swim."</i> </div> (Reference: State of Arizona Research Library. Online. https://azmemory.azlibrary.gov/nodes/view/328579).<br><br> |
| 8039 |  | Details | Mason, W.A. | 1887 |
| Unrecorded Manuscript Trace Cambridgeport Lands Frederick Lothrop Ames |
|
Mason, W.A. |
|
| 1887 |
| LOC:1401 |
| $2,750.00 | Mason--W-A- | Unrecorded-Manuscript-Trace-Cambridgeport-Lands-Frederick-Lothrop-Ames | A large, unrecorded pen and ink trace map on tracing cloth depicting lands on the Charles River Flats then held by the estate of Frederick Lothrop Ames (1) and associated owners, on the site now occupied by the Massachusetts Institute of Technology. The map was copied by William H. Whitney after Mason in the same month that the Massachusetts Legislature passed legislation that forced the cities of Cambridge and Boston to build the Harvard Bridge and share costs (2). Some portion of the map is attributed in pencil to a blueprint in Ames' possession, likely by W. A. Mason. Verso with the oval blue ink overstamp of William H. Whitney and index number 313.
<br><br>
The map was prepared in 1887, at a moment when the Charles River Embankment Company had begun construction of its granite seawall and was actively filling the Charles River Flats with dredged material from the river. It shows significant detail of the hydrography of the area including height in feet above low water at spring tide and the course of several small waterways including a detailed survey of Goff's Cove.
<br><br>Using the west line of the proposed Main Street extension, later realized as the Harvard Bridge, as a fixed boundary, and reading the notation on the mapped boundary, it appears Ames had already deeded lands west of this line to the Embankment Company. This drawing would have served as the working basis for negotiations over the remaining eastern portion of the Flats still under his ownership.
<br><br>
The sheet approximately covers the Charles River Flats from the navigable canal on the east to Goff's Cove on the west, and from the Boston and Albany Branch Railroad south to the planned 200 foot parkway along the riverbank. Detailed annotations at center record precise parcel boundaries totaling more than 2.3 million square feet and specify the fractional ownership interests of four parties, including Ames and the Charles River Embankment Company. Scale 80 feet to 1 inch.
<br><br> |
| 8038 |  | Details | Anonymous | 1971 |
| Rare California Is Not an Island Oakland Museum Poster |
|
Anonymous |
|
| 1971 |
| LOC:130 |
| $400.00 | Anonymous | Rare-California-Is-Not-an-Island-Oakland-Museum-Poster | An original 1971 exhibition poster “California Is Not an Island,” produced for a special show at the Oakland Museum (Cowell Hall of California History), held May 30 to August 1, 1971. Designed in a bold nineteenth century broadside style with heavy slab-serif lettering in red and black, the sheet advertises an exhibition centered on early documentary materials relating to California’s exploration, overland migration, and Gold Rush-era development. <br><br>At the top is a halftone reproduction of a later embellished edition of Nicolas de Fer's map of California "La Californie ou Nouvelle Caroline", preserving the insular outline and early eighteenth century geographical nomenclature. The reference to Father Eusebio Kino acknowledges the Jesuit explorer whose overland expeditions proved that California was a peninsula, a conclusion directly contradicted by the island form shown here and central to the exhibition’s theme.<br><br>
The body of the poster lists the exhibit’s scope: overland diaries and accounts, maps and drawings, broadsides and documents, rare books, manuscripts, prints, and lithographs. The emphasis on primary sources underscores the museum’s intent to demonstrate how early travelers, scientists, and explorers recorded the region and how these records shaped the narrative of westward movement and the building of the transcontinental railroad. Only two publicly recorded sales of this poster are known.<br><br>
Only two sales of this poster are recorded on the Internet.
<br><br>
The Oakland Museum of California opened during 1969, created from the merger of three older institutions devoted to art, history, and natural science. Housed in a landmark terraced concrete complex by architects Kevin Roche and John Dinkeloo, it was conceived as a new kind of interdisciplinary museum dedicated to the story of California. |
| 8034 |  | Details | Mayson, Thomas | 1875 |
| Victorian exhibition advertisement for Maysons Relief Ordnance Model |
|
Mayson, Thomas |
|
| 1875 |
| LOC:89 |
| $200.00 | Mayson--Thomas | Victorian-exhibition-advertisement-for-Maysons-Relief-Ordnance-Model | Original Victorian exhibition advertisement for Mayson’s 3D Ordnance relief model of the Lake District, Cumbria, North West England, created in 1875 as a major visitor attraction in Keswick. The broadside announces the enormous 210 square foot model exhibited daily at the Lake District Repository on Lake Road, a sculpted landscape built to a scale of six inches to the mile and rendered with exactness from Ordnance Survey data. Bold Victorian lettering, fern motifs, and a vignette of the Repository building frame the promotional text, which highlights mountains, lakes, rivers, waterfalls, villages, and roads shown in full relief and hand colored to nature.
<br><br>
The model was commissioned by Keswick photographer Henry Mayson and his brother Thomas and built by the Italian sculptor Raffaelle Monti and his team using Ordnance Survey sheets as the mathematical basis for every contour. The advertisement stresses its practical value for travelers, noting that the model was an essential tool for planning excursions and understanding the correct topography of the Lake District at a time when tourism was rapidly increasing. Daily opening hours, illumination during summer months, and a one shilling admission charge appear prominently in the lower text block.
<br><br>
As an example of nineteenth century exhibition ephemera, this poster documents one of the most ambitious public relief models ever constructed in Britain and preserves the original marketing for a landmark Lake District attraction. Surviving advertisements for Mayson’s Ordnance Model are scarce, and this sheet stands as a desirable item for collectors of British posters, Lake District history, and early Ordnance Survey derived cartography. |
| 8036 |  | Details | Nadon, Paul and Sandi | 1985 |
| Colorful pictorial advertising poster of Seward, Alaska |
|
Nadon, Paul and Sandi |
|
| 1985 |
| LOC:130 |
| $325.00 | Nadon--Paul-and-Sandi | Colorful-pictorial-advertising-poster-of-Seward--Alaska | Colorful pictorial poster map of Seward, Alaska, drawn by Paul and Sandi Nadon and published by New Sensations in 1985. The sheet presents the harbor town of Seward on Resurrection Bay as a busy cartoon landscape, with streets, businesses, and waterfront activity rendered in bright hand drawn vignettes rather than formal cartography. A large vertical Seward banner along the left margin, smiling sun over the Kenai Mountains, and playful notes in the margins firmly place the map in the late twentieth century tourist boom along the Alaska coast.
<br><br>
Within the town grid the artists label motels, cafes, shops, churches, and civic buildings, while the surrounding hills show wildlife, waterfalls, and campgrounds. The harbor is packed with cruise boats, fishing vessels, sailboats, and float planes coming and going from Resurrection Bay, all keyed to short text panels that highlight local attractions such as the Silver Salmon Derby. A puffin shaped compass rose, orcas, sea otters, and seabirds enliven the water, and humorous scenes on land convey the easygoing character of Seward as a working port and visitor destination.
<br><br>
More than a simple street plan, the poster functions as an illustrated directory of mid-1980s Seward, preserving the look of its downtown businesses, harbor facilities, and tourist culture at a particular moment in time. The map should appeal to collectors of Alaska ephemera, pictorial map posters, and American roadside tourism, it is an engaging wall piece that rewards close inspection, with dozens of local references and comic details scattered across the sheet.
<br><br> |
| 8037 |  | Details | Conrad, Maynard | 1955 |
| Ye Olde Charte Of Gull Lake Kalamazoo County Michigan |
|
Conrad, Maynard |
|
| 1955 |
| LOC:130 |
| $375.00 | Conrad--Maynard | Ye-Olde-Charte-Of-Gull-Lake-Kalamazoo-County-Michigan | Mid twentieth century blueprint pictorial map of Gull Lake in Kalamazoo and Barry Counties, Michigan, with hand-drawn shorelines, compass rose, and whimsical period lettering. The sheet captures the resorts, parks, beaches, and cottages that once ringed this deep spring-fed lake north of Kalamazoo, documenting the area as a regional leisure destination. The artist, Dr. Maynard Conrad (d. 1998) uses simple white linework on blue background to present an engaging portrait of the lake at a time when summer colonies, canoe clubs, and motor launches were beginning to reshape the shoreline.
<br><br>
The map highlights a tight cluster of neighboring lakes that define the Gull Lake region. Little Long Lake and Miller's Lake appear to the northwest, while Grassy Lake is shown just beyond the isthmus that separates Gull Lake from its smaller companions. These lakes form part of a distinctive kettle-lake chain created by the region's glacial geography, a landscape that helped establish Gull Lake as one of the most celebrated inland waters of southwest Michigan. The sheet also notes well known features of the day, including Idlewild, Ross Township Park, Island Park, Crescent Beach, the Country Club grounds, and the string of cottages along Lover's Lane.
<br><br>
This pictorial blueprint serves equally as a regional souvenir and a record of community identity around Gull Lake. Resorts such as Bayberry Inn, Hickory Point, and Walnut Inn, together with family parks, bird sanctuaries, and boat landings, illustrate a thriving recreational culture. Surviving large format blueprints of local lakeside development are scarce, and this example offers collectors an attractive combination of graphic charm, local history, and early twentieth century Michigan cartographic style. |
| 8030 | 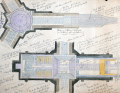 | Details | Crowder, Cyril C. | 1935 |
| Crowder Variable Expansion Propeller Design Drawings |
|
Crowder, Cyril C. |
|
| 1935 |
| LOC:130 |
| $300.00 | Crowder--Cyril-C- | Crowder-Variable-Expansion-Propeller-Design-Drawings | These three manuscript drawings are a striking artifact of early aviation ingenuity, capturing a bold experimental idea that never left the drafting table. Their meticulously rendered telescoping blades, mechanical sections, and handwritten annotations reveal a level of detail and ambition rarely seen in surviving 1930s aeronautical work. As a display piece, it stands at the intersection of engineering art and aviation history: visually compelling, technically imaginative, and representing a line of research that was too impractical for its time or even for today. Framed, it becomes not just a engineering drawing but a cool conversation piece about the inventive spirit of early flight and the folly of some inventors.
<br><br>
Crowder's variable expansion propellor was designed by Cyril C. Crowder of Hollywood, California. No information is found online about the designer nor is any patent found for the design.<br><br> |
| 8024 | 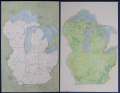 | Details | Paine, Howard E. | 1975 |
| Manuscript conceptual maps for Great Lakes–Midwest region |
|
Paine, Howard E. |
|
| 1975 |
| LOC:130 |
| $500.00 | Paine--Howard-E- | Manuscript-conceptual-maps-for-Great-Lakes–Midwest-region | Unpublished poster-size manuscript conceptual map ca. 1975 by National Geographic Art Director Howard Paine (1) presents a unified Great Lakes–Midwest region extending from Lake Superior to central Kentucky. Rendered in soft colored pencil and wash, the sheet studies regional physiography—rivers, watersheds, and upland structure—without the finished editorial layers of a production map. Paine experiments with state boundaries, drainage patterns, and implied landcover to test how a broad Midwest–Great Lakes treatment might read at atlas scale.
<br><br>
The verso carries a companion terrain study in the same hand, emphasizing elevation, forest cover, and hydrology with Paine’s characteristic, lightly modeled shading. Together the two drawings show the internal design process behind a National Geographic map that was never realized in print, offering a rare look at the developmental artwork that preceded formal cartographic production. They are among the few surviving privately-held examples of Paine’s pre-press regional concept work.<br><br> These conceptual sheets can be securely dated to the late 1960s through the mid-1970s, the period when National Geographic relied on hand-rendered shaded-relief masters and watercolor terrain studies for both its Atlas of the World (6th–8th editions) and the Close-Up U.S.A. series. The green land wash, blue-gray lake treatment, and pencil-modeled hydrology match the Society’s internal cartographic style of roughly 1968–1977, placing Howard Paine’s drafts squarely within that high phase of Nat Geo’s pre-digital map production. |
| 8020 | 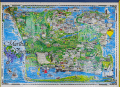 | Details | White Mountain Graphics | 1981 |
| Illustrated Pictorial Map of Martha’s Vineyard |
|
White Mountain Graphics |
|
| 1981 |
| LOC:130 |
| $300.00 | White-Mountain-Graphics | Illustrated-Pictorial-Map-of-Martha’s-Vineyard | A colorful illustrated poster map of Martha's Vineyard drawn by K. Rinaldo and published in 1981 by White Mountain Graphics. The poster is filled with hundreds of hand-drawn vignettes capturing island towns, harbors, beaches, landmarks, and summer pastimes. The artist uses a cartoonlike style to show ferries approaching Vineyard Haven, sailboats in Katama Bay, lighthouses, beaches, farms, and well-known establishments across Oak Bluffs, Edgartown, and Chilmark. Inset scenes, handwritten labels, humorous details, and decorative border elements give the sheet the character of a personal visual tour rather than a formal cartographic product.
<br><br>
The map functions as a record of Vineyard culture, highlighting cottages, inns, restaurants, bicycle routes, fishing spots, and community traditions that defined the island during the period. Its composition rewards close viewing, with dozens of local references rendered in a bright palette intended to evoke the island's summer energy. A striking pictorial map for collectors of Vineyard ephemera and American resort-town cartography.
<br><br>
White Mountain Graphics was a small New Hampshire-based illustration and design studio active primarily in the late 1970s and early 1980s. Operating out of Jackson, New Hampshire, the firm produced a range of commercially printed posters, pictorial maps, and souvenir-oriented visual materials, often in a hand-drawn style similar to the Martha's Vineyard map.
<br><br> |
| 8019 |  | Details | Taylor, Joseph | 1814 |
| Land Travelers Pocket Compass of Winds and Weather |
|
Taylor, Joseph |
|
| 1814 |
| LOC:78 |
| $550.00 | Taylor--Joseph | Land-Travelers-Pocket-Compass-of-Winds-and-Weather | Early 19th-century "Land Traveller's Pocket Compass," engraved and issued by Joseph Taylor. This is only the second example of this work by Taylor we can locate. No example of the item is found in WorldCat.
<br><br>Taylor prepared these pocket compasses for travelers, surveyors, and outdoorsmen who needed a simple guide for direction finding and basic weather prediction. The circular diagram is built from several engraved rings of text explaining how rainbow color, phase of the moon, and compass bearing of specific meteorological phenomena (wind, clouds, rain) were believed to signal approaching changes in the weather. These ideas reflect the early folk-meteorological rules that Taylor promoted in his printed work: "A rain-bow in the morning is the Shepherd's warning; but a rain-bow at night is the shepherd's delight."
<br><br>
Published for J. Taylor in 1814. With a manuscript dedication at bottom right: "From your lonely husband in Britain. 1943."
<br><br>
The piece blends practical instruction with decorative engraving. The central compass rose is surrounded by Taylor's explanatory text, while two ribbon panels carry short rules for reading clouds and winds. Although inexpensive and meant for everyday use, few examples survive because they were handled, carried, and eventually discarded. This sheet is therefore a rare artifact of early British scientific engraving and an unusual example of Joseph Taylor's work at the intersection of silversmithing, printing, and popular science. |
| 8016 |  | Details | Bower, N. E. | 1902 |
| Map of the U.S. Military Reservation, Fort Sill, Oklahoma Territory |
|
Bower, N. E. |
|
| 1902 |
| LOC:130 |
| $2,400.00 | Bower--N--E- | Map-of-the-U-S--Military-Reservation--Fort-Sill--Oklahoma-Territory | Unrecorded and important 1902 blueprint map documents the entire U.S. Military Reservation at Fort Sill, Oklahoma Territory, just five years before Oklahoma statehood and one year after the last Indian lands in Oklahoma opened for settlement. Compiled and drawn under the supervision of 2nd Lt. N. E. Bower, Corps of Engineers, the map was prepared for a Board of Officers convened on November 6, 1902 to review and verify the reservation’s boundaries, fences, roads, streams, and terrain. It presents the reservation in three components -- the Original Reservation, the Western Addition, and the Eastern Addition -- with detailed Public Land Survey System grids, contour lines, drainage, and the developed cantonment near Medicine Bluff Creek.<br><br>With the frontier gone and the cavalry mission fading, the fort shifted toward a new role as artillery units arrived, including the formation of the 39th Field Artillery Battery in 1902. This transition ultimately saved the fort from closure, and with the last cavalry regiment departing in May 1907, Fort Sill was firmly on the path to becoming the home of U.S. Army Field Artillery.<br><br>This map captures that transition with precision, drawing on General Land Office surveys, U.S. Engineer triangulations, earlier post maps, and contemporary field notes. Today the blueprint stands as an important visual record of the boundaries and landscape of one of the nation’s most significant western military posts, known as the later home of the Field Artillery School and the final residence of the Apache prisoners of war, including Geronimo.<br><br> |
| 7999 |  | Details | Landmark Adventures | 1992 |
| Greeville Avenue Dallas Texas Pictorial Map |
|
Landmark Adventures |
|
| 1992 |
| LOC:130 |
| $500.00 | Landmark-Adventures | Greeville-Avenue-Dallas-Texas-Pictorial-Map | This illustrated pictorial promotional poster map titled “Greenville Avenue: A Landmark Adventure – Dallas, Texas” depicts the full commercial corridor of Greenville Avenue using dense line-art drawings of individual businesses, landmarks, and street features. Drawn by Jack B. Weidner. Copyright Landmark Adventures, 1992-1993.
<br><br>The artwork organizes the avenue vertically, with north at the top, and identifies a large number of local establishments including restaurants, bars, boutiques, clubs, real-estate offices, and service businesses. Notable sites shown include the Doubletree Hotel, Old Town Shopping Center, Ada Art Gallery, Rollins, Corinthian Sailing Club, Pepe’s & Mito’s, The Diner, John’s Café, Flip’s, Nick’s Café, and many others. Corporate sponsors such as the Dallas Cowboys, Pepsi, Coors, RE/MAX, American Airlines, 94.5 The Edge, and Landmark Adventures appear within the composition, indicating commercial support at the time of publication. The map also includes playful vignettes—cars, pedestrians, musicians, hot-air balloons, aircraft, and neighborhood scenes—presented in a visually busy style meant to capture the character of the district.
<br><br>
Directional labels (Deep Ellum, McKinney Avenue), street names (Ross Avenue), and inset business directories help orient the viewer, while the border incorporates a decorative pattern consistent with late-20th-century pictorial map design. The poster functions as both a promotional guide and a snapshot of Greenville Avenue’s retail environment at the time it was created, documenting a concentration of independent businesses alongside well-known local institutions. As ephemera, it records the commercial identity of one of Dallas’s most recognizable streets and provides a detailed reference to storefronts and neighborhood culture that may no longer exist in the same form today. |
| 7992 |  | Details | Menendez, Anthony E. | 1899 |
| Map of Havana and Vicinity |
|
Menendez, Anthony E. |
|
| 1899 |
| LOC:86 |
| $250.00 | Menendez--Anthony-E- | Map-of-Havana-and-Vicinity | First edition map of Havana, Cuba and the surrounding area. Copyright 1899. Small inset coastal recognition view of the lighthouse and Morro Castle at the entrance to Havana Harbor opposite la Punta.
<br><br>
Scarce 1899 tourist map of Havana, Cuba, compiled and published by Anthony E. Menendez as the “Map of the City of Havana and Vicinity,” issued as the 1st Edition. Printed with a full street grid and surrounded by extensive indexes, the map identifies streets, parks, plazas, churches, markets, government offices, public buildings, hospitals, theaters, banks, and railway stations using an alphanumeric reference system. Major military and harbor defenses—including Morro Castle, La Cabaña, and La Punta—appear as engraved vignettes, along with illustrations of key civic structures across the city.
<br><br>
The plan captures the arrangement of Havana at the turn of the twentieth century during the U.S. military administration following the Spanish–American War. The city’s waterfront, harbor entrance, wharves, and ferry routes are clearly plotted, and the western suburbs and parklands are shown with their developing street patterns. A large inset at lower right depicts the Grand Hotel Pasaje, while advertising across the top margin promotes the “Cuba” brand cigarette, indicating commercial distribution of the map.
<br><br>
A detailed and visually engaging guide-map from a pivotal moment in Havana’s history, notable for its combination of practical indexing, architectural vignettes, and period promotional material. |
| 7991 | 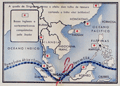 | Details | Wehrmacht Propaganda Service | 1942 |
| German WWII propaganda poster Japanese capture of Singapore |
|
Wehrmacht Propaganda Service |
|
| 1942 |
| LOC:130 |
| $450.00 | Wehrmacht-Propaganda-Service | German-WWII-propaganda-poster-Japanese-capture-of-Singapore | Scarce German propaganda poster from World War II produced by the Wehrmacht Propaganda Service following the fall of Singapore in February 1942. Once considered the “Gibraltar of the East,” Singapore’s swift collapse to Japanese forces was seized upon by German propagandists to ridicule Britain’s waning imperial power and the failure of Allied defenses in Asia.
<br><br>
Titled “Singapura em poder dos japoneses,” the poster presents four scenes of Japanese troops advancing through jungle terrain, tanks on the move, and aircraft strafing the island’s airfields. At the center, a map dramatizes the Allied supply routes to Singapore being severed—depicted with a pair of scissors—and highlights captured British and American bases throughout the South China Sea, the Philippines, and Malaya, symbolizing the Axis narrative of unstoppable Japanese expansion.<br></br>
Only two examples of this poster are found in WorldCat.
<br><br>
At bottom: "A castello forte britanico na Grande Asia foi desbarratado Churchill e Roosevelt tambem ali perderam a jogo" reflecting the magnitude and impact of the defeat.
<br></br>
Verso with Portuguese text related to Singapore and details of the conflict in Asia.
<br></br> |
| 7995 |  | Details | Nadon, Paul | 1985 |
| Humorous pictorial map of Breckenridge, Colorado from 1985. |
|
Nadon, Paul |
|
| 1985 |
| LOC:130 |
| $450.00 | Nadon--Paul | Humorous-pictorial-map-of-Breckenridge--Colorado-from-1985- | This colorful pictorial poster map of Breckenridge, Colorado, created and signed by Paul Nadon, presents a detailed illustrated view of the town’s commercial core and surrounding mountain setting as it was in the mid-1980's. The drawing highlights Main Street and nearby blocks through individually rendered storefronts, lodges, restaurants, ski shops, and local businesses, each shown with distinctive architectural and graphic detail. The map functions as a stylized guide to the businesses of the period while offering a snapshot of Breckenridge during the mid-1980s. Copyright New Sensations, 1985.
<br><br>
Across the landscape, Nadon incorporates a wide variety of playful elements—skiers descending the slopes, hikers, wildlife, a hot-air balloon, a rainbow, and humorous scenes referencing local recreation. Hand-lettered notes provide bits of local history and commentary, while decorative banners and figures add to the informal, tourist-friendly tone of the piece. Despite the whimsical aesthetic, the arrangement of streets and buildings follows the real alignment of Main Street, Ridge Street, Park Avenue, and French Street.
<br><br>
Produced at a time when Breckenridge was expanding as a Rocky Mountain ski destination, the map captures the town’s commercial identity at a moment of growth. Its combination of detailed storefront depictions, vibrant illustrations, and personable local character makes it both a practical period guide and a visually engaging souvenir from 1980s Breckenridge.<br><br> |
| 7987 | 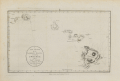 | Details | Harrison, John | 1784 |
| A New Chart of the Sandwich Islands including oWhyhee Hawaii |
|
Harrison, John |
|
| 1784 |
| LOC:3 |
| $1,100.00 | Harrison--John | A-New-Chart-of-the-Sandwich-Islands-including-oWhyhee-Hawaii | Engraved chart of the Hawaiian Islands issued shortly after the publication of the official account of Captain Cook’s third voyage (James King; June, 1784). This chart was published one month later in London by Harrison & Co., on July 1, 1784. It traces the routes of Cook’s ships Resolution and Discovery through the Hawaiian archipelago and highlights “oWhyhee” (Hawaiʻi), where Cook met his death in February 1779.
<br><br>
Based closely on Henry Roberts’ official chart but without the inset of Kealakekua Bay, Harrison’s version was created for a popular audience eager for news of the famous explorer’s final journey.
The map offers one of the earliest separately issued depictions of the Hawaiian Islands, capturing the moment when they first entered European geographic consciousness.
<br><br>
Printed from a finely engraved copper plate, the chart combines geographic accuracy with contemporary drama, naming each island and noting Cook’s fatal landing. Examples of this edition are far scarcer than those bound in the official voyage atlas, making it a sought-after piece for collectors of Pacific exploration and early Hawaiian cartography.
<br><br> |
| 7984 |  | Details | Howells, Rulon S. | 1961 |
| Map of The Mormon Exodus to the Rocky Mountains |
|
Howells, Rulon S. |
|
| 1961 |
| LOC: |
| $300.00 | Howells--Rulon-S- | Map-of-The-Mormon-Exodus-to-the-Rocky-Mountains | Scarce mid-20th-century educational wall poster depicts the westward migration of the Mormon pioneers from the eastern United States to the Great Salt Lake Valley. The map traces multiple overland and sea routes—from early settlements in New York, Ohio, and Illinois across Iowa, Nebraska, and Wyoming to Utah—with fine line work and green-toned shading that visually emphasizes the journey’s progression.
<br><br>
Illustrations along the route show covered wagons, handcarts, and pioneer figures, while smaller vignettes depict scenes such as the Mormon Battalion’s march and seaborne emigrant routes from Europe. At lower left, a narrative block summarizes the migration’s history, noting Brigham Young’s leadership and the founding of the Great Salt Lake settlement in 1847.
<br><br>
Printed in green and black on white stock, the map carries the imprint: “A Teaching Aid – The Mormon Story – Teaching Aids, Inc., Highland Park, Illinois.” This poster was likely used in classrooms and religious education settings during the 1960s, part of a broader trend toward illustrated historical maps as visual teaching tools. An attractive and informative example of mid-century American educational cartography.
<br><br>
Published by Bookcraft, Inc, 1961. |
| 7875 |  | Details | Holladay, John | 1992 |
| Rare Apocalyptic View of Los Angeles After Earthquake Puzzle |
|
Holladay, John |
|
| 1992 |
| LOC: |
| $385.00 | Holladay--John | Rare-Apocalyptic-View-of-Los-Angeles-After-Earthquake-Puzzle | Scarce and fun 1000 piece pictorial view puzzle titled LA Shake and Bake, created in 1992 by illustrator John Holladay and published by F. X. Schmid. Puzzle is unopened in original shrink wrap as issued. <br><br>The puzzle presents a satirical pictorial view of Los Angeles shattered by a massive quake, with districts sliding toward the Pacific Ocean in a dense and humorous cartoon style. The image plays on long standing California earthquake lore. It was also issued by Schmid as an uncut poster. When assembled, the puzzle measures 26.5 by 17.25 inches.<br><br>
Holladay's theme draws on the popular misconception that California might someday break off along the San Andreas Fault, an idea that traces back to public misunderstanding of Andrew Lawson's 1906 report describing lateral motion after the San Francisco earthquake. His phrasing that the Pacific side moved northward relative to the American side echoed for decades, inspiring exaggerated public fears and giving artists like Holladay fertile ground for satirical disaster scenes. The puzzle captures that cultural myth with vivid color and a chaotic, engaging layout.<br><br>
LA Shake and Bake also reflects the long publishing history of F. X. Schmid, founded in Munich in 1860 and best known for toys, cards, and later board games and puzzles. By the 1970s and 1980s the company had expanded internationally, including a U.S. division that produced widely distributed puzzles like this one. Financial pressures in the mid 1990s led to a 1997 merger with Ravensburger, marking the end of Schmid as an independent maker. This puzzle stands as one of the imaginative late period Schmid releases, combining contemporary humor, geological lore, and striking packaging design.
<br><br>
Box size roughly 15.5" x10". |
| 8088 |  | Details | Suchy, Arthur Bartholomew | 1940 |
| Stunning Map Cayo Hueso Key West Florida Collectors Edition |
|
Suchy, Arthur Bartholomew |
|
| 1940 |
| LOC:61 |
| $1,575.00 | Suchy--Arthur-Bartholomew | Stunning-Map-Cayo-Hueso-Key-West-Florida-Collectors-Edition | Large original Arthur Suchy pictorial birds-eye map of Cayo Hueso or Key West, Florida. Printed in black ink. Designed, executed, produced and first copyrighted by Arthur Suchy ca. 1938. Purchased from Suchy's estate liquidation. Watermarked "Linweave TEXT Made in USA". Rarely have we seen a map of this age in such pristine condition. Modern hand color.
<br><br>
Suchy identifies alphabetically and numerically over 70 locations that surround the view including:
<div class="indenttextblocksingle">
<ul style="list-style-type: circle;"></li>
<li>Cigar factories</li>
<li>P.A.A. Airport</li>
<li>Turtle crawls</li>
<li>Fish market</li>
<li>Warbler (helpful tug)</li>
<li>Pepe's coffee shop</li>
<li>Delmonico's</li>
<li>Key West radio station</li>
</ul>
</div>
Arthur Bartholomew Suchy (1901 - 1995) produced two editions of his famous map of Cayo Hueso- this, the first larger-size Collectors Edition was produced in a limited quantity of 100 copies dated to 1940. As Suchy received orders for the maps he would hand color each map before shipment.
<br><br>
The second and smaller edition was printed in red ink to 1941. [1] Includes numerous historical notes about Key West.
<br><br>
Suchy was issued a copyright for the Collectors Edition on Dec. 14, 1938.
<br><br>
[1] David Rumsey Map Collection at Stanford University Libraries |
| 7863 |  | Details | Miller, Charles C. | 1948 |
| Annotated Sales Map of Rolling Hills, Eastfield Drive, California |
|
Miller, Charles C. |
|
| 1948 |
| LOC:78 |
| $250.00 | Miller--Charles-C- | Annotated-Sales-Map-of-Rolling-Hills--Eastfield-Drive--California | Annotated real estate subdivision map of the Eastfield Drive area of Rolling Hills on California's Palos Verdes Peninsula. Issued by the Palos Verdes Corporation under president Kelvin C. Vanderlip, the map promotes "Country Life - City Conveniences," with horseback-rider emblems reinforcing the development's rural, equestrian identity.<br><br>
The plan identifies numbered parcels with acreage and boundary dimensions along Eastfield Drive, Outrider Road, Chuckwagon Road, Open Brand Road, and adjacent streets. Winding roads serve irregularly shaped lots, many exceeding one acre, with larger holdings of several acres interspersed throughout. An inset location plan places the tract within the surrounding road network.<br><br>
Extensive manuscript annotations in red, blue, and pencil record apparent asking prices, selected parcels, and sales calculations. Figures include $6,250 beside lot 56 and $8,900 beside lot 113, while another note reads "118 $4,500-clear." These additions suggest use as a working sales or property-selection map, preserving evidence of land marketing during the peninsula's development.<br><br>
Credited to Charles C. Miller, Civil Engineer, Los Angeles, California. Dated withing to March, 1948. |
| 7864 |  | Details | Holladay, John | 1992 |
| Pictorial Poster View of Los Angeles Submerged After Earthquake |
|
Holladay, John |
|
| 1992 |
| LOC:89 |
| $800.00 | Holladay--John | Pictorial-Poster-View-of-Los-Angeles-Submerged-After-Earthquake | Fine medium-format satirical poster of Los Angeles titled LA Shake and Bake, created in 1992 by illustrator John Holladay. Very rare, with no institutional holdings found in WorldCat and no recorded sales of the poster on the Internet. <br><br>The artwork presents a dramatic cartoon vision of the city shattered by a massive quake, with hills cleaving open, and whole neighborhoods transformed into islands in a rising blue sea. Holladay fills the sheet with humorous detail, from boats navigating through canyon walls to crowds celebrating on newly formed shorelines. The Hollywood Hills, downtown high rises, and coastal districts are all reimagined as fragments of a fractured landscape, creating a lively blend of regional caricature and disaster fantasy that reflects long standing popular myths about California earthquakes.<br><br>
Issued by Holladay Prints independent of the moderately rare F. X. Schmid puzzle edition (in stock 12/25), this poster allows the viewer to appreciate the full composition without the grid of puzzle cuts. The image captures the playful anxiety of early 1990s Los Angeles culture, shaped by real seismic events like the 1992 Landers sequence and by public misconceptions that California might one day fall into the Pacific. With its bright palette, dense pen work, and packed narrative scenes, LA Shake and Bake stands as a memorable example of late twentieth century pictorial satire devoted to one of America’s most iconic urban landscapes. |
| 8118 |  | Details | Hayden, Walter Emmet | 1941 |
| Mono County Hayden Fishermans Paradise Map 1941 |
|
Hayden, Walter Emmet |
|
| 1941 |
| LOC:63 |
| $350.00 | Hayden--Walter-Emmet | Mono-County-Hayden-Fishermans-Paradise-Map-1941 | Early, scarce, 1941 edition of the Hayden Map Company's Fisherman's Paradise map for Mono County, California. Map # 818415. South oriented at upper left. Copyright 1941. Verso blank.
<br><br>
Shows numerous and substantial advertiser differences from the 1952/1955 edition at the Rumsey Map Collection and several topographic and road changes including but not limited to:
<div class="indenttextblocksingle">
<ul style="list-style-type: circle;">
<li>Lake Crowley covers a greater area in the 1941 edition, with the eastern portion of the lake extending past Chalk Bluff. Global warming? </li>
<li>In the 1955 edition Hayden extended map coverage to the northwest by approximately 4 miles and included Saddlebag Lake, perhaps to make room for additional advertisements.</li>
<li>The 1955 edition shows a new road linking U.S. 395 in the vicinity of Birchim Canyon to a feeder road and following the Owens River Road.</li>
<li>The 1955 edition no longer shows the road from rock creek Lake as extending along the Little Lakes Valley all the way to Lang Lake</li>
<li>In the 1955 edition upper right contains a price for the map of 25 cents, the price not included in the earlier edition.</li>
</ul>
</div> |
| 6545 |  | Details | Mason, Charles and Jeremiah Dixon | 1769 |
| 1769 Mason and Dixon Map of Chesapeake Bay and the Delmarva Peninsula |
|
Mason, Charles and Jeremiah Dixon |
|
| 1769 |
| LOC:78 |
| $400.00 | Mason--Charles-and-Jeremiah-Dixon | 1769-Mason-and-Dixon-Map-of-Chesapeake-Bay-and-the-Delmarva-Peninsula | Antique engraved map documenting the region of Charles Mason and Jeremiah Dixon's measurement of a degree of latitude for the Royal Society. Published in London's <i>Gentleman's Magazine</i> in 1769, the map covers Chesapeake Bay, the Delmarva Peninsula, and Delaware Bay, extending from Philadelphia south to the Virginia capes. Named settlements include Baltimore, Annapolis, Dover, and New Castle, with rivers, principal roads, and coastal islands shown.
<br><br>
The map records the geographical setting of Mason and Dixon's scientific work to determine the ground distance corresponding to a degree of latitude. Undertaken during their American surveying mission, this measurement contributed to the study of the earth's dimensions and form. The prominent north-south survey line through the peninsula relates to this work.
<br><br>
This is the second edition of the map first published with Mason's report in the Royal Society's <i>Philosophical Transactions</i> in 1768. The rectangular title panel names both surveyors, while the upper-right imprint reads "Gent. Mag. Nov. 1769." A fleur-de-lis north indicator, mileage scale, and latitude markings complete the engraving. |
| 8139 |  | Details | Heck, Georg | 1851 |
| Construction and Internal Arrangement of a Wooden Warship |
|
Heck, Georg |
|
| 1851 |
| LOC:78 |
| $140.00 | Heck--Georg | Construction-and-Internal-Arrangement-of-a-Wooden-Warship | Detailed engraved plate illustrating the construction and internal arrangement of a large wooden sailing warship. A central longitudinal cutaway reveals the vessel's multiple decks, gun positions, mast supports, storage compartments, and carefully distributed supplies. Casks, coiled rope, and other stores fill the hold, showing how the ship's interior accommodated the equipment and provisions required for extended service.<br><br>
Additional elevations and sections illustrate the hull's timber framework, diagonal bracing, exterior planking, and underwater form. Smaller numbered figures examine structural joints, fastenings, curved timbers, and transverse hull sections, while geometric drawings record the curves used to define the vessel's shape. The plate combines practical construction details with an unusually informative view of a warship's working interior.<br><br>
Engraved by Henry Winkles, whose imprint appears at the lower right. Marked "Taf. 9" in the upper margin. |
| 8154 |  | Details | Leon, Eli | 1968 |
| Unreleased fish-eye birds-eye view poster 1968 California Berkeley Centennial |
|
Leon, Eli |
|
| 1968 |
| LOC:87 |
| $900.00 | Leon--Eli | Unreleased-fish-eye-birds-eye-view-poster-1968-California-Berkeley-Centennial | Scarce and extremely fine 60's-era poster view of the campanile and campus of the University of California Berkeley, a dizzying birds-eye view taken with a fish-eye lens. This masterful poster was designed by Eli Leon and printed in 1968 for the centennial of Berkeley's founding. According to the Oakland Museum of California's web site, who owns the only other known online copy of this poster: <br><br>
<div class="indenttextblocksingle">
"According to the artist, this poster was commissioned by U.C. Berkeley <u>but never released</u>. [LMC] [1]"
</div>
<br>
Robert Stanley Leon (1935-2018) was best known as a collector of African American quilts, but is credited with the creation of this rare poster despite having no known training in the visual arts.
<div class="indenttextblocksingle">
"Eli Leon was an Oakland-based collector, scholar, and champion of African American quiltmakers whose gift of nearly 3,000 quilts to BAMPFA <i>[UC Berkeley Art Museum and Pacific Film Archive]</i> has made possible an inspiring future of scholarship and presentation here in Berkeley. In addition to collecting artwork, Leon also compiled a massive–and unruly–collection of raw materials and textiles." [2]
</div>
<br><br>
Sources:
<br><br>
[1] Eli Leon ~ artist. 2022. Online: http://collections.museumca.org/?q=collection-item/201054808<br>
[2] BAMPFA. From the Estate of Eli Leon: Textile Improvisations. Online: "https://bampfa.org/event/estate-eli-leon-textile-improvisations |
| 8150 |  | Details | British Admiralty Hydrographical Office | 1907 |
| Antique British Nautical Chart of Baja California and Sea of Cortez |
|
British Admiralty Hydrographical Office |
|
| 1907 |
| LOC:68 |
| $1,600.00 | British-Admiralty-Hydrographical-Office | Antique-British-Nautical-Chart-of-Baja-California-and-Sea-of-Cortez | Back by popular demand, this increasingly scarce, authentic antique British nautical chart includes the states of Baja California, Baja California Sur, Sonora, Mexico and the Sea of Cortez. <b>Interesting seller's stamp in blue for W. H. Sproull and Co. , Newcastle New South Wales [Australia].</b>
<br><br>
This large chart will make a very attractive gift for anyone with an interest in fishing or boating in the vicinity of Baja California. Numerous well-known fishing spots are noted including: San Jaime Bank, Golden Gate Bank, Outer Gorda Bank, Finger Bank, and Morgan Bank. Two inset profiles of Cabo San Lucas. Engraved by Davies and Company.
<br></br>
This is a later edition of a British Admiralty chart first engraved and published from London in 1879, and updated numerous times after that. Last major corrections from 1900 and printed in 1907.
<br></br>
Coverage includes the entire Baja Peninsula and Gulf of California (Sea of Cortez) from San Diego, California to Cabo San Lucas, Mexico. Contains detailed names of the numerous rivers, lights, capes, and bays surrounding the Baja Peninsula. For example: Todos Santos Bay, Rosario Bay, Boca de Santo Domingo, Port San Bartolome, Cape San Lazaro, Santa Margarita Island, Lusitania Bank, Magdalena Bay, Pescadero Point, San Jose del Cabo Bay, Ceralbo Island, and San Jose Island.
<br></br>
This bold dark lithographed chart retains the cartographic look and style of the late 19th century. Logo of the British Hydrographical Office at top of the title block. Published from London on April 9, 1879 (1907). Number 2324 |
| 4949 | 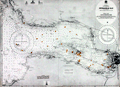 | Details | British Admiralty Hydrographical Office | 1919 |
| St. Petersburg Russia Petrograd Bay (Neva Bay) |
|
British Admiralty Hydrographical Office |
|
| 1919 |
| LOC:57 |
| $675.00 | British-Admiralty-Hydrographical-Office | St--Petersburg-Russia-Petrograd-Bay-(Neva-Bay) | Antique nautical chart of PETROGRAD BAY (Neva Bay) and St. Petersburg, Russia copied from Russian Surveys made between 1831-1894. Manuscript corrections in red ink dated to 1919. Lighthouses and other navigational aids are marked in orange.
<br></br>
First published at the Admiralty March 19, 1855 under the superintendence of Captain Washington. Sold by J.D. Potter. This issue with final minor corrections up to 1919. Chart number 2279.
<br></br>
Four inset sketches of important local aids to navigation including:
<br></br>
<div class="indenttextblocksingle">
<ul style="list-style-type: circle;">
<li>Krasnaya Gorka Signal Station</li>
<li>Pitka Point Tower</li>
<li>Stirs Point Lighthouse</li>
<li>Tolbenkin Lighthouse</li>
</ul>
</div> |
| 2550 |  | Details | Clouet, Jean-Baptiste | 1787 |
| Fine antique print of a wind rose. |
|
Clouet, Jean-Baptiste |
|
| 1787 |
| LOC:88 |
| $270.00 | Clouet--Jean-Baptiste | Fine-antique-print-of-a-wind-rose- | Large delicately colored original engraved example of a wind rose by J.B. Clouet. The 32 winds of the wind rose are each named in French, Italian, Latin, and Spanish (e.g. for the West wind: "Ouest", "Ponente", "Favonius Zephirus" and "Oeste"). This fine antique wind rose is surrounded on two sides by French text and measures 12 inches in diameter. |
| 1090 | 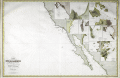 | Details | Robiquet, Aime | 1856 |
| Rare Antique French Chart of the California Coast and Baja Peninsula |
|
Robiquet, Aime |
|
| 1856 |
| LOC:63 |
| $1,800.00 | Robiquet--Aime | Rare-Antique-French-Chart-of-the-California-Coast-and-Baja-Peninsula | Very rare engraved chart of the California coast from Shelter Cove south to Mazatlan, Mexico: "Carte des Côtes de Californie de Mazatlan à San Francisco d'Après les derniers Travaux Amércains Par Robiquet, Hydrographe Rue Pavée Saint Andre No.2. Paris 1856". This large chart is particularly interesting for its collection of numerous inset plans of North American West Coast ports and bays during the late California Gold Rush.
<br></br>
Coverage includes the <b>Baja Peninsula</b> or "Vieille Californie" with Cabo San Lucas ("Cap St. Lucas") at the end. Contains inset plans of the bays and ports at Guaymas, Ballena, St. Bartholomé, Pulpito, San Quentin, San Diego, San Pedro, Monterey, San Francisco, and Bodega Bay.
<br></br>
Scarce and detailed map of California's coastline, with much detail for navigation and a few inland landmarks. Printed in Paris by French hydrographer and publisher Louis Antoine Robiquet. Presumably from Robiquet's "Atlas Hydrographique" of 1856, but this printing with separate price (4 francs) and publisher's blind stamp in bottom right margin. Only one institutional copy is recorded in WorldCat.
<br></br>
Inset plans include: (1): Baie Bodega Levé en 1839 par Ed. Belcher. (2): Plan de la Baie de Monterey Levé en 1837 par Mr. De Tessan, Ingr. Geographe. (3): Entrée du Port de San Francisco par Cadwalader Ringgold. (4): San Pedro par James Alden 1852. (5): Entrée de San Diego par R.D. Cutts et G. Davidson. (6): Port San Quentin Levé in 1839 par Ed. Belcher. (7): Port St. Bartholomé Levé par le Cape. H. Kellet en 1847. (8): Mouillage Pulpito par le Cape. H. Kellet. (9): Port Balleno par le Cape. H. Kellet. (10): Guaymas Levé par Mr. Fisquet en 1840.
<br></br>
No. 61. Paris - Imp. Louis |
| 50 | 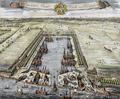 | Details | Kip, Johannes | 1728 |
| Howland Great Dock near Deptford |
|
Kip, Johannes |
|
| 1728 |
| LOC:64 |
| $800.00 | Kip--Johannes | Howland-Great-Dock-near-Deptford | A scarce early 18th century engraved view of the Howland Great Wet Dock (later Greenland Dock) at Rotherhithe, depicting one of the earliest purpose built wet docks in England and a key stage in London's transition from medieval tidal wharfage to enclosed, engineered dock systems. This view has margins > 3 inches. Shown from an elevated birds eye perspective, the composition centers on the rectangular dock basin with its lock entrance to the Thames, where vessels remain afloat at constant water level, a significant technical advance for fitting out, repair, and long term mooring. The surrounding slips, yards, cranes, and ancillary structures are rendered with functional clarity, presenting the dock as modern working infrastructure rather than a picturesque river view.<br><br>
The landscape context is especially revealing. The dock is set amid extensive tree cover and open ground, reflecting the still semi rural character of Rotherhithe in the late 17th and early 18th century. At this date, heavy maritime industry coexisted directly with pasture, orchards, and managed estate land, long before the dense urbanization of the later Georgian docks. The trees are therefore not decorative additions but accurate markers of an early industrial riverside landscape.<br><br>
The wooded setting also had practical importance. Trees stabilized soft riverbank soils and reclaimed ground, and acted as windbreaks for the exposed basin. Their orderly placement reinforces the docks role as a planned improvement, signaling permanence, investment, and control rather than ad hoc industrial growth. Engraved by Johannes Kip, the view combines topographical accuracy with a promotional intent, asserting the technical competence and commercial ambition behind one of London's earliest modern docks.<br><br> |
| 8167 |  | Details | Gavit, John E. | 1850 |
| Vermont, New York and Canada - Gavit's Reduction of Bernard Romans's Revolutionary War Map |
|
Gavit, John E. |
|
| 1850 |
| LOC: |
| $150.00 | Gavit--John-E- | Vermont--New-York-and-Canada---Gavit-s-Reduction-of-Bernard-Romans-s-Revolutionary-War-Map | Circa 1850 reduced edition of Bernard Romans's 1778 map of the northern Revolutionary War theater, engraved and printed by John E. Gavit of Albany. The map covers Vermont, eastern and northern New York, portions of New Hampshire and Massachusetts, and adjoining Canada. Its unusual orientation places north toward the lower left, with Lake Ontario and the St. Lawrence River across the lower portion of the sheet.<br><br>
Townships, land grants, patents, rivers, settlements and forts fill the map, documenting both the region's geography and competing claims to its lands. Lake Champlain and the Hudson River form a central corridor, while the Adirondack interior bears the name "Coughsagrage," or the Dismal Wilderness. Large tracts and named purchases contrast with the closely divided townships farther east.<br><br>
The prominent designation "State of Vermont" preserves a defining feature of Romans's original, recognized as the first printed map to name Vermont as a state. A lengthy note at upper left defends Vermont settlers' land titles and condemns conflicting New York grants, making the map a political statement as well as a geographical record.<br><br>
The lower margin identifies this edition as reduced from an original held in the Office of the State Engineer and Surveyor. An informative nineteenth-century rendering of an important Revolutionary-era map. |